There are many Masters in Data Science programs that have been developed over the last few years including at universities, massive open online courses (MOOCs) such as the Data Science Specialization on Coursera or if you're really self motivated an Open Source Data Science Masters curriculum that you can work through at your own pace. A few weeks ago I was happy to see my graduate school alma mater (Rice University in Houston, TX) announced that it was awarded a $1.4 million dollar grant from the NSF to start a Data Science program between faculty in the Statistics and Computer Science departments. The money will be used to develop courses by faculty in both departments and to allow undergraduate students, graduate students and postdoctoral researchers to take courses and complete research projects. This comes after the university announced last fall a $43 million dollar investment of establishing a world-class program in data science. I look forward to seeing exciting things from these two initiatives!
Congrats to Rice!
Showing posts with label Rice University. Show all posts
Showing posts with label Rice University. Show all posts
Wednesday, August 3, 2016

Monday, May 20, 2013
Graduation and Other Oddities
The last few months have been filled with excitement and new adventures. I sincerely apologize for the lack of posts. I promise more statistical/scientific posts will follow very soon. For now, let me try to share a few highlights from the last few months.
In March, we welcomed a new addition to our household: a 2013 Scion FR-S (color 'hot lava')! We are still working on naming it, but currently the top two contenders are the 'Atomic Carrot' and the 'CarrotMonster'. Here is a picture of Chris grinning ear to ear in the car lot the day we drove it home:



To close, I leave you with a fun Pi Day fact to ponder (courtesy of my Dad) :)

In March, we welcomed a new addition to our household: a 2013 Scion FR-S (color 'hot lava')! We are still working on naming it, but currently the top two contenders are the 'Atomic Carrot' and the 'CarrotMonster'. Here is a picture of Chris grinning ear to ear in the car lot the day we drove it home:
After a few months of getting to know the car and taking 'an extreme driving course', Chris put the car to the test at the Sports Car Club of America (SCCA) autocross. Here a group of cars getting lined up to race:
Later in March Rice University was host to the Conference of Texas Statisticians (COTS). Keith Baggerly gave a beautiful keynote talk discussing his famous talk When is Reproducibility an Ethical Issue? Genomics, personalized medicine, and human error. See his appearance on 60 Minutes for further details related to the story about Potti at Duke University.

April was a very exciting month around here! I ran in the Digital Run 5K Houston with a wonderful group of friends. It was advertised as a 'nocturnal wonderland' filled with lots of LED lights, fun music and an after party! Amazingly it was quite cold the night we ran, so here we are all bundled up with our cool glasses:
Finally, the main reason the frequency of posts have come to a halt was the successful completion of my Ph.D. defense on April 12th! The Hooding ceremony was held on May 10th in which my research advisor Marek Kimmel (pictured below) was able to hood me:
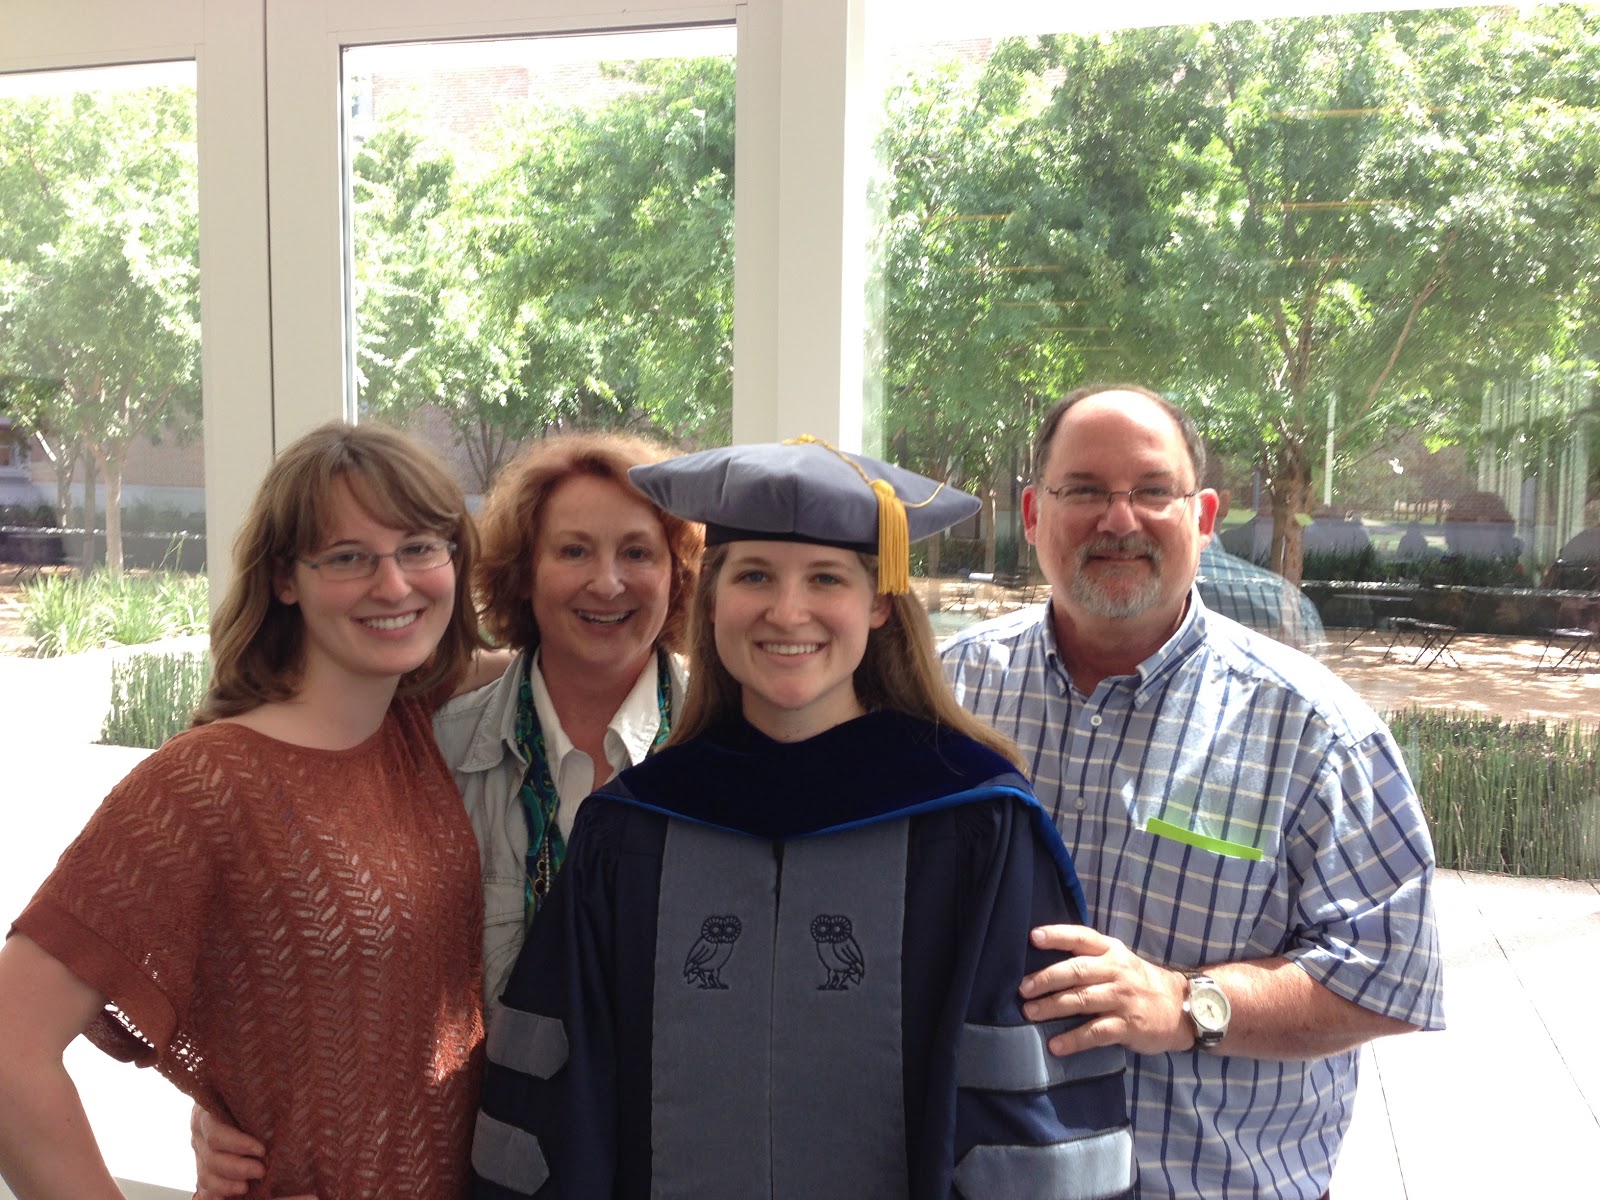
Rice University's 100th Commencement ceremony was held May 11th and we were fortunate enough to have Neil deGrasse Tyson as our commencement speaker! :) Here are a few pictures of my amazing family:

Tuesday, October 9, 2012
Rice University's Centennial Celebration
Rice Institute President Edgar Odell Lovett opened the Rice Institute on October 12, 1912 and this week Rice University will have its centennial celebration October 10-14, 2012!
There are many, many events going on this week including the Centennial Lecture Series, homecoming, alumni reunion weekend, performances and parties. I just want to highlight one of the lectures scheduled for tomorrow:
Centennial Lecture Series #1: J. Craig Venter - Wed Oct 10 3-4pm in the Tudor Fieldhouse
Abstract: Perhaps most famous for being among the first to sequence the human genome, Dr. Venter in 2010 created the first cell with a synthetic genome. He has been listed as one of the world's most influential people by both Time magazine and the British New Statesman. Venter also is tackling energy (stating that algae show promise); last year he published a high-profile paper on the first creation of synthetic life that included then-Rice student Thomas Segall-Shapiro as an author.
Calendar of all events: Centennial calendar
Google Calendar specifically for all the graduate student events: tinyurl.com/GSAcentennial
Happy Centennial Rice University!
There are many, many events going on this week including the Centennial Lecture Series, homecoming, alumni reunion weekend, performances and parties. I just want to highlight one of the lectures scheduled for tomorrow:
Centennial Lecture Series #1: J. Craig Venter - Wed Oct 10 3-4pm in the Tudor Fieldhouse
Abstract: Perhaps most famous for being among the first to sequence the human genome, Dr. Venter in 2010 created the first cell with a synthetic genome. He has been listed as one of the world's most influential people by both Time magazine and the British New Statesman. Venter also is tackling energy (stating that algae show promise); last year he published a high-profile paper on the first creation of synthetic life that included then-Rice student Thomas Segall-Shapiro as an author.
Calendar of all events: Centennial calendar
Google Calendar specifically for all the graduate student events: tinyurl.com/GSAcentennial
Happy Centennial Rice University!
Thursday, May 17, 2012
Interface 2012: Day 2
JCGS Highlights at the Interface session
With several great choices to pick from, my Day 2 of the Interface conference began in the JCGS Highlights at the Interface session to listen to Jennifer Le-Radamacher of University of Georgia give a talk on using symbolic-coveriance PCA and visualization techniques for interval-valued data. The visualizations she showed were very interesting, but it was suggested she check out the colorspace palette in R to further improve her figures.
Information Mining session
Next, I moved to the Information Mining session to hear William Szewcyzk from the NSA give a talk on streaming exploratory data analysis. He began by summarizing the process of data analysis in five steps: 1) choose a default model which is very controversial subject in itself because he said even if you just describe the data with its mean and variance, you are implicitly assuming the data can be described by the first and second moments of the distribution 2) project your data onto the model 3) examine the fit or lack thereof of the data to the model 4) adjust the model accordingly 5) repeat. For streaming data, you have to make a slight modification to this process because people incorrectly assume they think they are the only ones working on that flow of data and their process is the last one to touch the data. Finally he proposed a "default model for streaming data" similar to the way people often assume a gaussian distribution as the default model for static data. The last speaker of the session Andy Frenkiel of IBM gave a thought provoking talk on filling in the gaps of news stories when there is missing information using keyword searches.
Contributed Paper Session II
Xueying Chen of Rutgers University began this session with her split and conquer approach for extremely large datasets. In her talk, she randomly splits a data set into subsets, estimates a penalized logistic regression model within each subset and finally combined the estimates from the subsets in a final set of coefficient estimates. The second speaker was Garrett Grolemund of Rice University (pictured below) who gave a wonderful demo of his R package Lubridate which greatly simplifies the process of working with dates, times and time zones. Some great features include the ability to display the same instant of time in different time zones, to save and use time intervals as a class object in R and the test whether certain dates fall "%within%" a different set of dates. I'll also advertise for his online course for Visualization in R with ggplot2 on June 19-20!

David Kahle of Baylor University (pictured below) gave the final talk of the session on his useful R package mpoly which allows user to work with multivariate polynomials within R. There are three other packages in R which work with polynomials, but they are not very intuitive or efficient to work with. Some features include a new class of mpoly objects, basic arithmetic/calculus such as gradients, algebra, and finally evaluating polynomials.

Woman VS Machine: The Inference Battle session
After lunch, quite a few conference attendees move into the Woman VS Machine: The Inference Battle session. The session began with Andreas Buja who gave a thought-provoking talk on the problems with post-selection inference and proposed the Post Selection Inference (PoSi) constant which allows valid post-selection inference. Interestingly, PoSi guarantees coverage of CIs and Type I errors of tests and is not specific for any type of model selection. The second speaker in the session Heike Hofmann outlined the concepts of visual inference within the framework of exploratory data analysis. In a classical statistical setting, we reject the null hypothesis if the test statistic is past some threshold, but in a visual setting, she argued we would reject the null hypothesis (i.e a plot is not distinguishable from null plots) if the data plot is identifiable. A great example was shown in which she simulated random data in four dimensions and included one plot with the real signal. Due to the artifact of high dimensionality, the audience was not able to pick it out (including me!). Finally, she described a set of experiments they designed using Amazon Mechanic Turk in which they recruited people to look at a line-up of plots to pick out which ones were different from the rest using criteria such as bi-modality, outliers and mean shift (and showed how the power estimates). Very curious results. The last speaker Mahbub Majumder described these "Turk experiments" in greater detail. The session ended with a great question from the audience about the reproducibility of this type of research (which I believe should be as long as the same plots could be used again).
Banquet Keynote
Mark Hansen of UCLA gave an amazing keynote talk for the banquet tonight! I was very impressed with the quality of graphics and art projects he has produced over the last decade.
I will wrap up with a few pictures from the banquet of some current and past PhD students at Rice.


With several great choices to pick from, my Day 2 of the Interface conference began in the JCGS Highlights at the Interface session to listen to Jennifer Le-Radamacher of University of Georgia give a talk on using symbolic-coveriance PCA and visualization techniques for interval-valued data. The visualizations she showed were very interesting, but it was suggested she check out the colorspace palette in R to further improve her figures.
Information Mining session
Next, I moved to the Information Mining session to hear William Szewcyzk from the NSA give a talk on streaming exploratory data analysis. He began by summarizing the process of data analysis in five steps: 1) choose a default model which is very controversial subject in itself because he said even if you just describe the data with its mean and variance, you are implicitly assuming the data can be described by the first and second moments of the distribution 2) project your data onto the model 3) examine the fit or lack thereof of the data to the model 4) adjust the model accordingly 5) repeat. For streaming data, you have to make a slight modification to this process because people incorrectly assume they think they are the only ones working on that flow of data and their process is the last one to touch the data. Finally he proposed a "default model for streaming data" similar to the way people often assume a gaussian distribution as the default model for static data. The last speaker of the session Andy Frenkiel of IBM gave a thought provoking talk on filling in the gaps of news stories when there is missing information using keyword searches.
Contributed Paper Session II
Xueying Chen of Rutgers University began this session with her split and conquer approach for extremely large datasets. In her talk, she randomly splits a data set into subsets, estimates a penalized logistic regression model within each subset and finally combined the estimates from the subsets in a final set of coefficient estimates. The second speaker was Garrett Grolemund of Rice University (pictured below) who gave a wonderful demo of his R package Lubridate which greatly simplifies the process of working with dates, times and time zones. Some great features include the ability to display the same instant of time in different time zones, to save and use time intervals as a class object in R and the test whether certain dates fall "%within%" a different set of dates. I'll also advertise for his online course for Visualization in R with ggplot2 on June 19-20!

David Kahle of Baylor University (pictured below) gave the final talk of the session on his useful R package mpoly which allows user to work with multivariate polynomials within R. There are three other packages in R which work with polynomials, but they are not very intuitive or efficient to work with. Some features include a new class of mpoly objects, basic arithmetic/calculus such as gradients, algebra, and finally evaluating polynomials.

Woman VS Machine: The Inference Battle session
After lunch, quite a few conference attendees move into the Woman VS Machine: The Inference Battle session. The session began with Andreas Buja who gave a thought-provoking talk on the problems with post-selection inference and proposed the Post Selection Inference (PoSi) constant which allows valid post-selection inference. Interestingly, PoSi guarantees coverage of CIs and Type I errors of tests and is not specific for any type of model selection. The second speaker in the session Heike Hofmann outlined the concepts of visual inference within the framework of exploratory data analysis. In a classical statistical setting, we reject the null hypothesis if the test statistic is past some threshold, but in a visual setting, she argued we would reject the null hypothesis (i.e a plot is not distinguishable from null plots) if the data plot is identifiable. A great example was shown in which she simulated random data in four dimensions and included one plot with the real signal. Due to the artifact of high dimensionality, the audience was not able to pick it out (including me!). Finally, she described a set of experiments they designed using Amazon Mechanic Turk in which they recruited people to look at a line-up of plots to pick out which ones were different from the rest using criteria such as bi-modality, outliers and mean shift (and showed how the power estimates). Very curious results. The last speaker Mahbub Majumder described these "Turk experiments" in greater detail. The session ended with a great question from the audience about the reproducibility of this type of research (which I believe should be as long as the same plots could be used again).
Banquet Keynote
Mark Hansen of UCLA gave an amazing keynote talk for the banquet tonight! I was very impressed with the quality of graphics and art projects he has produced over the last decade.
I will wrap up with a few pictures from the banquet of some current and past PhD students at Rice.


Wednesday, May 16, 2012
Interface 2012: Day 1
Today was the first day of the 43rd Interface Conference 2012 which is being held at Rice University this year (follow me with updates on twitter with hashtag #Interface12) There were several concurrent technical sessions going on through out the day, so I only post about the ones I attended. It was an early start to the morning, but the coffee definitely helped. :)

Keynote speaker
The keynote speaker Trevor Hastie from Stanford gave a wonderful talk this morning on methods for low-rank factorization with missing data (perfect application for the Netflix data). He specifically discussed the methods Soft-Impute (soft threshold SVD) and Hard-Impute and showed their relationship to the Maximum Margin Matrix Factorization (MMMF). His method has an expectation-maximization flavor to it and is similar to alternating ridge regression. Finally he ended with a few generalizations including Convex Robust Completion (Robust SVD). When the data matrix X can be approximated by L (a low-rank matrix) + S (sparse matrix), then the method just adds a penalty parameter on a sparse matrix in addition to penalty parameter on the low rank matrix. I enjoyed the level of detail in this talk.

Software Development in R session
After the keynote, I decided to attend the Software Development in R technical session. The first speaker JJ Allaire (founder of Rstudio) gave a great high level demo of many useful features in Rstudio. He stressed the importance of "reproducible research" and "trustworthy computing". Some of the most exciting things in Rstudio include: a searchable history for any piece of code ever run through the console, page back through plots, quickly traverse through nested functions, interact with Git and SVN and incorporation of Sweave and knitr. You can easily navigate between chunks of code and even be pointed back to the source code after clicking on a complied pdf. Rstudio now has the feature of writing in the markdown language to quickly publish high quality web pages instead of having to deal with html. The second speaker in the session Norm Matloff of UC Davis discussed parallel computing in R. He reviewed classical shared-memory loop scheduling methods (static, dynamic, time-varying chunk size, etc) and how to these might be adapted to R. The example he discussed was how to parallelize all possible regressions in a given data set with dim(X) = n x p. The available R packages discussed for parallel computing were:
1) snow - serializes/deserializes communications which takes time; most used R package; the functions clusterApply() is static and clusterApplyLB() is dynamic; both limited to a fixed chunk size of 1 (small chunk sizes not good because of high overhead); chunk size > 1 must be programmed by user
2) Rmpi - more flexible than snow, but still has serialization and network problems
3) mclappy/multicore - each call involves new unix process creation
4) gputools - each call involves a GPU kernel invocation, time intensive; major overhead
He suggested a new scheduling method called 'Random Scheduling'. After making this small adjustment, then you can use the R packages as before (e.g. snow). For his presentation slides go here and his open source book go here. The final speaker of the session Duncan Murdoch gave a great overview of the older tools available for debugging and some examples of visual debuggers.
Statistical Models for Complex Functional Data session
The session started out with Todd Ogden of Columbia University who discussed sparse functional principal component regression to predict depression using MRI images as the functional data. He mentioned other statistical learning tools such as random forests may be more accurate, but he advocated for using a regression-based method with functional data because functional regression has a clear interpretation of the weight function. After expressing the functional components in the wavelet domain he applies penalization techniques such as wavelet-based LASSO to the functional model. The basic idea is to perform sparse functional principal component analysis and then use the loadings as the predictors. The second speaker Lan Zhou of Texas A&M showed how to use penalized bivariate B-splines in functional data analysis to estimate variability in Texas temperatures over the past 100 years. Because Texas or the "domain" is complicated (e.g. not rectangular, contains holes, etc), she uses the idea of triangulations. The goal is to estimate a bivariate smooth function over the domain to create a temperature map using data from weather stations and to investigate the variability in temperatures over the years. Veera Baladandayuthapani of UT MD Anderson wrapped the session up by discussing a bayesian functional mixed model for copy-number variation data measured by aCGH array data and extending it for SNP array data (higher resolution). The goal was to do a joint analysis on set of samples to look for a small signal by borrowing strength between the samples.
So far the talks have been excellent and I'm looking forward to the rest of the sessions tomorrow and Friday!

Keynote speaker
The keynote speaker Trevor Hastie from Stanford gave a wonderful talk this morning on methods for low-rank factorization with missing data (perfect application for the Netflix data). He specifically discussed the methods Soft-Impute (soft threshold SVD) and Hard-Impute and showed their relationship to the Maximum Margin Matrix Factorization (MMMF). His method has an expectation-maximization flavor to it and is similar to alternating ridge regression. Finally he ended with a few generalizations including Convex Robust Completion (Robust SVD). When the data matrix X can be approximated by L (a low-rank matrix) + S (sparse matrix), then the method just adds a penalty parameter on a sparse matrix in addition to penalty parameter on the low rank matrix. I enjoyed the level of detail in this talk.

Software Development in R session
After the keynote, I decided to attend the Software Development in R technical session. The first speaker JJ Allaire (founder of Rstudio) gave a great high level demo of many useful features in Rstudio. He stressed the importance of "reproducible research" and "trustworthy computing". Some of the most exciting things in Rstudio include: a searchable history for any piece of code ever run through the console, page back through plots, quickly traverse through nested functions, interact with Git and SVN and incorporation of Sweave and knitr. You can easily navigate between chunks of code and even be pointed back to the source code after clicking on a complied pdf. Rstudio now has the feature of writing in the markdown language to quickly publish high quality web pages instead of having to deal with html. The second speaker in the session Norm Matloff of UC Davis discussed parallel computing in R. He reviewed classical shared-memory loop scheduling methods (static, dynamic, time-varying chunk size, etc) and how to these might be adapted to R. The example he discussed was how to parallelize all possible regressions in a given data set with dim(X) = n x p. The available R packages discussed for parallel computing were:
1) snow - serializes/deserializes communications which takes time; most used R package; the functions clusterApply() is static and clusterApplyLB() is dynamic; both limited to a fixed chunk size of 1 (small chunk sizes not good because of high overhead); chunk size > 1 must be programmed by user
2) Rmpi - more flexible than snow, but still has serialization and network problems
3) mclappy/multicore - each call involves new unix process creation
4) gputools - each call involves a GPU kernel invocation, time intensive; major overhead
He suggested a new scheduling method called 'Random Scheduling'. After making this small adjustment, then you can use the R packages as before (e.g. snow). For his presentation slides go here and his open source book go here. The final speaker of the session Duncan Murdoch gave a great overview of the older tools available for debugging and some examples of visual debuggers.
Statistical Models for Complex Functional Data session
The session started out with Todd Ogden of Columbia University who discussed sparse functional principal component regression to predict depression using MRI images as the functional data. He mentioned other statistical learning tools such as random forests may be more accurate, but he advocated for using a regression-based method with functional data because functional regression has a clear interpretation of the weight function. After expressing the functional components in the wavelet domain he applies penalization techniques such as wavelet-based LASSO to the functional model. The basic idea is to perform sparse functional principal component analysis and then use the loadings as the predictors. The second speaker Lan Zhou of Texas A&M showed how to use penalized bivariate B-splines in functional data analysis to estimate variability in Texas temperatures over the past 100 years. Because Texas or the "domain" is complicated (e.g. not rectangular, contains holes, etc), she uses the idea of triangulations. The goal is to estimate a bivariate smooth function over the domain to create a temperature map using data from weather stations and to investigate the variability in temperatures over the years. Veera Baladandayuthapani of UT MD Anderson wrapped the session up by discussing a bayesian functional mixed model for copy-number variation data measured by aCGH array data and extending it for SNP array data (higher resolution). The goal was to do a joint analysis on set of samples to look for a small signal by borrowing strength between the samples.
So far the talks have been excellent and I'm looking forward to the rest of the sessions tomorrow and Friday!
Tuesday, April 10, 2012
Steve Stigler gives a talk at Rice University
As part of the celebration the 25th anniversary of the Department of Statistics at Rice University, Steve Stigler gave a talk yesterday titled 'How a Statistical Idea Saved Darwin's Theory and Much More'. He began his talk with some old pictures of how the department was founded including pictures of the founding mathematics department in 1927.

Then Steve discussed some very influential mathematicians and probabilists who helped contributed to some important ideas in statistics such as 'The Rule of Three'. A brief summary would be if the following relationships holds
\[ \frac{A}{B} = \frac{C}{D} \]
and you know any of the three out of the four (A, B, C, D), then you can easily solve for the fourth. In 1855, Charles Darwin is even quoted saying, "I have no faith in anything short of actual measurement and the Rule of Three". Karl Pearson suggested this be the motto of the journal Biometrika. For a full description of the story, see the publication Stigler (2012) in Biometrika.
Interestingly, Francis Galton made the discovery that if data were perfectly correlated then the Rule of Three is true. When data is not perfectly correlated, then the idea of a conditional distribution must be introduced. The example that led to this discovery was an anthropologist was studying skeletons in a grave site. He let $T$ = length of a man's thigh bone and $H$ = man's height. After measuring several complete skeletons, he averaged $m_T$ = mean of thigh bones and $m_H$ = mean of heights. Then anthropologist wanted to infer heights from thigh bone lengths. He made the assumption that
\[ \frac{m_T}{m_H} = \frac{T}{H} \]
What Galton discovered is that if the data were perfectly correlated, then this formula would work. Because this assumption did not hold, Galton stumbled on to what we now call correlation. This led to the idea of expectations of conditional distributions, and hence the regression line! Very interesting story.
Steve ended his talk with some encouraging words about the Statistics Department at Rice. He showed this picture which was taken at Rice when Emile Borel visited.

The night ended with a nice dinner in Duncan Hall hall with pictures, awards and a lovely cake.

Congratulations to the Department of Statistics at Rice! I'm excited to see what the next 25 years has to hold.

Then Steve discussed some very influential mathematicians and probabilists who helped contributed to some important ideas in statistics such as 'The Rule of Three'. A brief summary would be if the following relationships holds
\[ \frac{A}{B} = \frac{C}{D} \]
and you know any of the three out of the four (A, B, C, D), then you can easily solve for the fourth. In 1855, Charles Darwin is even quoted saying, "I have no faith in anything short of actual measurement and the Rule of Three". Karl Pearson suggested this be the motto of the journal Biometrika. For a full description of the story, see the publication Stigler (2012) in Biometrika.
Interestingly, Francis Galton made the discovery that if data were perfectly correlated then the Rule of Three is true. When data is not perfectly correlated, then the idea of a conditional distribution must be introduced. The example that led to this discovery was an anthropologist was studying skeletons in a grave site. He let $T$ = length of a man's thigh bone and $H$ = man's height. After measuring several complete skeletons, he averaged $m_T$ = mean of thigh bones and $m_H$ = mean of heights. Then anthropologist wanted to infer heights from thigh bone lengths. He made the assumption that
\[ \frac{m_T}{m_H} = \frac{T}{H} \]
What Galton discovered is that if the data were perfectly correlated, then this formula would work. Because this assumption did not hold, Galton stumbled on to what we now call correlation. This led to the idea of expectations of conditional distributions, and hence the regression line! Very interesting story.
Steve ended his talk with some encouraging words about the Statistics Department at Rice. He showed this picture which was taken at Rice when Emile Borel visited.

The night ended with a nice dinner in Duncan Hall hall with pictures, awards and a lovely cake.

Congratulations to the Department of Statistics at Rice! I'm excited to see what the next 25 years has to hold.
Thursday, March 15, 2012
Nearly 800,000 lung cancer death averted by decline in smoking
The results from a major study on lung cancer conducted by six institutions (including Rice) was released yesterday in the Journal of National Cancer Institute. The goal of the study was to ask how many deaths have been prevented after the release of the US Surgeon General's report on Smoking and Health in 1964. This is the first time the NCI is publishing a paper of this magnitude on estimates of lung cancer deaths using all model-based approaches. It was estimated nearly 800,000 lung cancer deaths have been averted from 1975-2000 with the decline in smoking. What's the most impressive is that if smoking had been completely eliminated, then it was estimated that 2.5 million deaths would have been prevented.
Wednesday, March 14, 2012
Pi Day Celebration at Rice
Today the three math-oriented departments at Rice (MATH, STAT and CAAM) put together an event to celebrate Pi Day! We had pies from House of Pies, pizzas (i.e. pies), a Pi Recitation contest, and also a fundraiser for the National Math and Science Initiative. The way it worked was the department that donates the most amount of money gets to pie a professor from that department in the face. Hadley Wickham from STAT, Steve Cox from CAAM, and Andy Putman from MATH all graciously agreed to take one from the team. Due to some logistical issues at the last minute, it was decided that all three would pie each other.
Here are a few pictures of the event and below is a movie. In the first picture, Darren Ong (graduate student from MATH who organized most of the event) is cheering them on saying "Pie them all!"


For those who want to see the play by play:
Thank you to everyone who helped put this event all together! Also thank you to the three departments, GSA, SIAM, and AWM for their financial support.
Here are a few pictures of the event and below is a movie. In the first picture, Darren Ong (graduate student from MATH who organized most of the event) is cheering them on saying "Pie them all!"


For those who want to see the play by play:
Thank you to everyone who helped put this event all together! Also thank you to the three departments, GSA, SIAM, and AWM for their financial support.
Thursday, March 8, 2012
Khan Academy
Salman Khan, founder of Khan Academy, is scheduled to be the commencement speaker for Rice University's commencement this May. I haven't heard of Khan Academy before, but it's basically like the MIT Open Courseware but better! It's a non-for-profit website that is trying to bring a free-education to anyone anywhere. They are not full-length classes, but short clips on individual topics, including SAT test preparation. After you watch the video, you can test your knowledge using the practice exercises.
My dad keeps saying that education is going to go through a big change in the near future because all the online education opportunities. With websites like this, it's hard not to agree. The only thing this doesn't give you is a formal degree. Unfortunately, we live in a society in which you often need the actual degree to get a job even if you have taught yourself the material. Interestingly, I think this will push universities (e.g. Rice) to incorporate more online courses so anyone anywhere can sign up to take the classes as long as you pay the tuition. The question I still have is will websites like this eventually drive the cost of education down because there is so much freely available information out there?
My dad keeps saying that education is going to go through a big change in the near future because all the online education opportunities. With websites like this, it's hard not to agree. The only thing this doesn't give you is a formal degree. Unfortunately, we live in a society in which you often need the actual degree to get a job even if you have taught yourself the material. Interestingly, I think this will push universities (e.g. Rice) to incorporate more online courses so anyone anywhere can sign up to take the classes as long as you pay the tuition. The question I still have is will websites like this eventually drive the cost of education down because there is so much freely available information out there?
Subscribe to:
Posts (Atom)