Happy New Year everyone! After a wonderful holiday break, I was excited to find my copy of
AMSTAT News from the
American Statistical Association in my mailbox! Someone pointed out to me that if you look close enough, I can be found standing in the background on the front cover of the Dec 2016 issue. So, apparently I can check off 'being on the cover a magazine' from my bucket list. ;)
The
picture was a snapshot of an audience at talk from the
Women in Statistics and Data Science Conference (WSDS) 2016 which was held in Charlotte, North Carolina Oct 20-22, 2016. The
cover story can be found here. In 2014, I attended the
inaugural Women in Statistics Conference and was fortunate enough to attend the conference again this year! Looking back through blogposts this fall, I realized I did not write a blog entry after I returned from the conference, but I
did manage keep a few notes in a Github repo of a few of the talks. Here, I want to summarize some of my thoughts and experiences of WSDS 2016 and at the end I describe a few suggestions for future WSDS conferences. I was not able to attend all the talks mostly because there were many concurrent sessions happening at the same time, but I hope this highlights at least a portion of the conference!
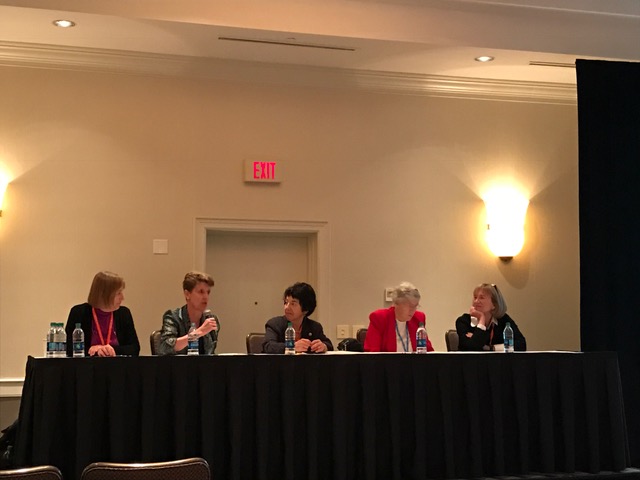
The picture above was taken in a talk by one of my favorite speakers from the 2016 conference, Erin Anika Wiley from
Westat, titled "
Do you Hear What I Hear?: An Examination of Effective Communication". I managed to slip into the back of jammed packed room and furiously write down notes on the results of a survey she conducted asking about opinions of presentations from statisticians. I love that this was the front cover of the magazine because Erin really had the audience laughing and engaged for her entire talk. Also, it was humbling and enlightening to hear the survey responses on how non-statisticians perceive statisticians based on talks and presentations. Definitely motivation for how we
can communicate our results more effectively!
The first keynote address was from
Cynthia Clark titled "
Consider your legacy". She gave inspirational talk discussing what her contributions have been in her personal and professional life. As a new mother, I sincerely appreciated hearing how she prioritized her family throughout her life.

Another great keynote address was from
Stacy Lindborg at
Biogen with a talk titled "
Know your power". Stacy is a natural at connecting with the audience by sharing personal stories from her life. In this talk, she shared five reflections/tips on having a successful career in the face of many challenges (both personal and professional). One of my favorite quotes from her talk was "We love the things that we are good at", which really resonated with me.
Keeping with theme of careers, a topic I found particularly interesting is how to navigate changes in your career. Michelle Dunn, Donna LaLonde, and Nancy Flournoy shared very honest and personal experiences of following non-traditional career paths, recognizing and moving forward when you have failed, and knowing when to leave a job. A central theme from each of their talks was to always be growing your network and find trusted individuals/mentors to help you navigate these experiences.
Similar to the session in 2014, the 2016 conference included a fantastic panel of the past, current and future ASA Presidents. These women were able to persevere in the face of a highly male-dominated field to become ASA Presidents and become role models for women in the early stages of their career like me. Even with all this progress, I agree with
Mary Ellen Bock that there is so much more work still to do with supporting more specific minority groups in this field. For example, she eloquently described her hope of one day seeing a non-white woman on this panel of presidents.
In my opinion, one of the coolest sessions was listening to the amazing
Mary W. Gray from American University giving a fascinating discussion on what US laws exist to protect women. If you don't know who she is, you can read a
summary on wikipedia, which is pretty incredible! One of my favorite things that I learned about her was that she wears a 3/4 euro lapel pin (noting pay inequality is not limited to the US) to promote "equal pay for equal work" referring to the Equal Pay Act in 1963 and Title VII in 1964. Sadly I didn't get a picture of the lapel pin, but I love the idea!
Wendy Martinez from the Bureau of Labor Statistics gave a great keynote address on what and how federal statistical agencies are thinking about when it comes to data science. Data science is something I am passionate about, so I really enjoyed this talk. I would have loved to see a larger emphasis on data science education though.
Unfortunately
Bin Yu from UC Berkeley was unable to join us in person, but the conference organizers were able to set up a video chat and connect to the big screen! Her talk was titled "
A holistic approach to interdisciplinary research" where she began discussing how she has a people centric view of life and research (people are mysteries to unveil just like research). It was amazing to hear a little bit about her background and how she grew up in China during the cultural revolution (1966-1976) where the universities stopped for 10 years. Something I think that cannot be overstated was she noted that she most appreciates intellectual diversity in collaboration and research. Overall, it was an inspiring talk!
The conference ended with a festive dinner filled with new friends, awards, presentations and delicious desserts!
As the conference took place at a hotel, I managed to find a nice location to
write down some notes from the talks on my GitHub page. :) Feel free to check them out for more details on the talks that I attended.

Finally, I want to finish this blogpost with a few suggestions for future WSDS conferences. My intention is for these suggestions to be viewed as constructive to help make this conference stronger and more accessible to women in the future.
- Fewer talks running concurrently and more posters/speed sessions. I appreciated that the keynote talks did not have other scheduled talks, but at other times I had to choose between 5-6 sessions running concurrently, which led to frustration and disappointment that I missed so many other talks. My arguments for this are similar to the ideas previously described to improve JSM (decreasing the number of contributed sessions and increasing the presence and importance of poster sessions).
- More talks from women in data scientist positions in academia, government, and industry. I recognize that the term "data science" is very much being actively debated in many settings, but as this conference now has "data science" in the title, I would love to see a larger discussion of data science and how that relates to statistics, here too. There was such a great representation of perspectives from women who pioneered this field. I think it would be equally beneficial to include the perspective from a new generation of women in data science positions.
- Childcare. I was surprised to find out that no childcare was available at this conference. Considering a good portion of this conference was dedicated towards discussing issues related to balancing careers with families, I found a lack of childcare a bit ironic (?). This suggestion is motivated by my own personal experience of recently having a baby. I saw several other WSDS attendees who brought their children and probably could have benefited from a childcare service. There are great childcare examples broken down by cost, size of conference, childcare agency, fees charged, etc. I hope this will be incorporated in future WSDS conferences.
Thank you to all the conference organizers for putting together this
conference. I look forward to the next one in La Jolla, CA Oct 19-21, 2017!