Friday, October 17, 2014

Fall in Love with Apple Crisp

Fall is in full swing around here. We have had a few rainy days, the leaves are starting to change colors and the cool weather is descending upon us.  In fall, one of my favorite things to make is my mom's apple crisp!

I have great memories of watching her make a warm soup or spaghetti to go along with the apple crisp.  This is probably one of my favorite desserts next to a dark chocolate mousse! The best part is the apples do not need to be sweetened up with any sugar.  Between the naturally sweet apple pieces and sweet crunchy topping, you won't miss the extra sugar!


To make the apple crisp, you can go to the store to buy the ingredients, but if you live near an orchard, I highly suggest going to pick your own.  This is the second year wear have been able to pick our own apples at a local orchard and we always come back with at least 1/2 bushel of apples.  The picture below 1/4 of a bushel because the other 1/4 went home with a friend of mine who came to visit Boston.  I want to say it was around 35 apples.


To make the apple crisp you need the following ingredients

Ingredients
- 4-5 large apples
- 1/2 cup butter (1 stick)
- 1 cup brown sugar
- 1/2 cup all-purpose flour
- 1 cup old-fashioned oats
- pinch of salt and cinnamon
- 1/2 teaspoon vanilla

Recipe

1) Start by combining the flour and oats. 


2) Next, mix in the cinnamon and salt with the flour mixture.


3) In a separate bowl mix the brown sugar, butter and vanilla until well blended. Add the flour mixture to the brown sugar mixture.  The topping should be crumbly.


4) Peel and quarter the apples. Cut the quarters into even thinner pieces if you want slices instead of quarters of apples.  Place the apples in an 8x8 baking pan.  


5) Finally, add the topping to the sliced apples and bake at 350 degrees for 20 minutes.  The apples should just be starting to get soft, but not mushy.  The crumble topping should also be getting crispy.  Hopefully you will enjoy it as much as I do this time of the year!  

Monday, October 13, 2014

Where did summer go??

I can hardly believe summer has come and gone already.  This was arguably one of the busiest summers I've ever had.  Unfortunately, that left very little time to blog about everything going on.  I want to remedy that and get back into blogging regularly.  I apologize already for all the pictures coming in this post, but I decided to do one long post recapping summer rather than several short ones.

Summer kicked off with my sister's beautiful wedding in early May.  The wedding was held outdoors at Cedar Bend Events around 20 miles south of Austin, TX. Their ceremony started with both her and her husband dancing down the aisle to Happy by Pharell Williams.  If you know my sister, it was very fitting!


All of the bridesmaids and flower girls were asked to wear floral dresses and cowboy boots which turned out to be a lot of fun! The only problem was trying to find cowboy boots in the middle of March in Boston. It was worth the search though! 


One of my favorite pictures was this one [left to right] of me, my mom and my sister Vanessa.


We had so many friends and family there to celebrate with Vanessa & Cory on their wedding day.  The day turned out absolutely perfect and I couldn't be happier for both of them.  


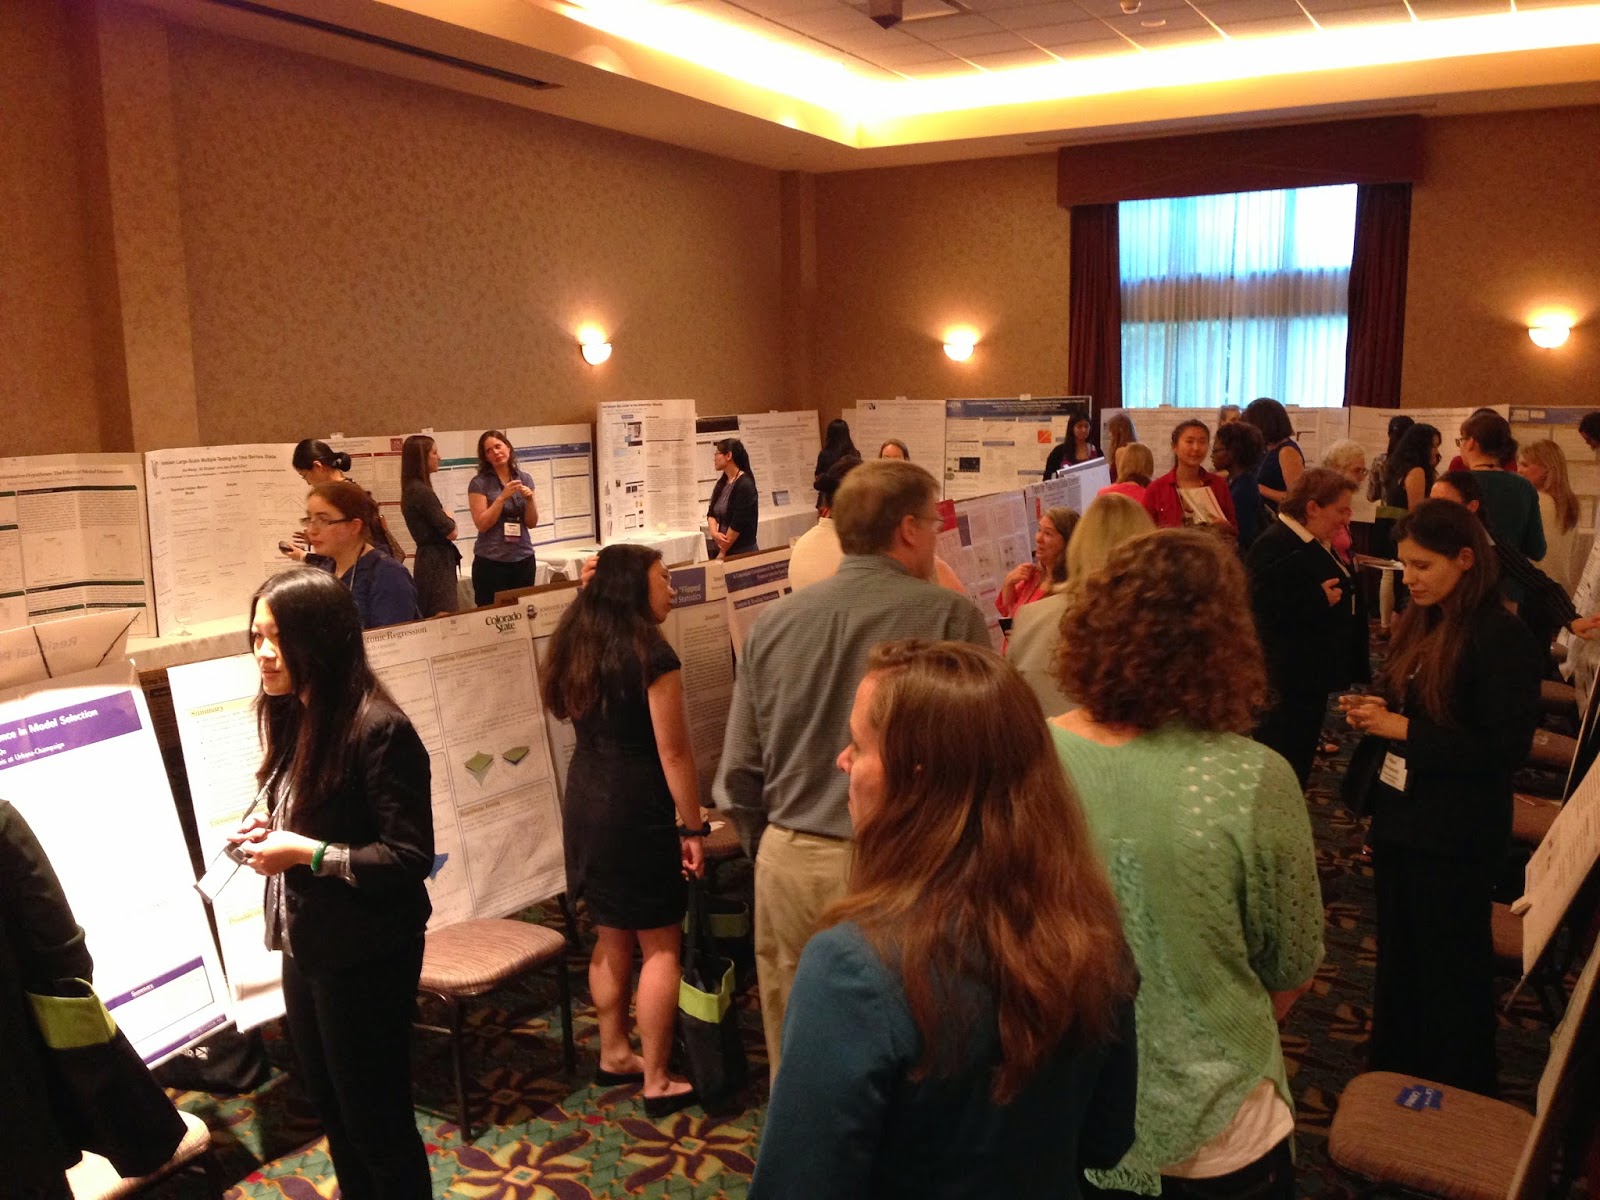
Two weeks later I was off to the inaugural Women in Statistics Conference held in Cary, NC. That was one of the two events I did blog about this summer, so rather than elaborating on it again, I encourage you to read the blogs linked above.  I will say this: the entire conference has had a lasting effect on me.  I love the old friends and new friends I was able to meet.  New opportunities have come out of it, and I am very grateful that I was able to be a part of the conference. I look forward to the next one!

On a more heavy-hearted note, we lost my grandmother to cancer at the beginning of June. She had been battling cancer for several years now, but it was still very hard on our family.  This is an older picture of my sister and I with her from Easter many years ago.


We were fortunate enough to have all of the family come together for the funeral in Concord, CA. The picture below was taken at The Warehouse Cafe in Port Costa


We took this picture of my dad with his two brothers and dad (my grandfather) by the railroad tracks and the water next to the restaurant.


Somewhere in the middle of the summer, Chris and I found time to explore Boston a little bit too.  We canoed down the Charles River (twice!): 


We attended our first Red Sox game:


We made our first lobster rolls:


and took a duck boat tour around Boston with an out of town guest who came to visit us!


At the end of June, we had our annual BCB Department Retreat which was very informative and fun including catching the end of one of the world cup matches at lunch time!


At the end of July, there were two major conferences happening back to back: Bioconductor Conference (BioC 2014) and the Joint Statistical Meetings (JSM 2014), both held in Boston this year. I had never attended a Bioconductor conference, but I really enjoyed meeting the major contributors and developers behind it. Here is a picture from BioC developer day:


Here are two pictures fom JSM advertising the This is Statistics campaign:


In addition to the conferences, I also found time to fit in progress on my research.  I submitted an R package to Bioconductor called quantro and it was successfully accepted a few weeks later!  Also, one of my projects required some of my calculus to be dusted off the shelf, so I drew this to explain my feelings on the subject at the time. :)


Finally, the biggest news of the summer was I got married Labor Day weekend!  I figured I had already maxed out my photo quota for one blog post, so stay tuned for that in the next post.  For now I leave you with this picture of our penguin cake topper which was designed, 3D printed [design available on thingiverse] and painted by my husband Chris! :)


I promise to get back to my usual posts very soon!  I hope everyone had a restful and productive summer.

Friday, June 13, 2014

World Cup and Word Clouds in R

Yesterday two cool things happened. Wait, three cool things happened. It was the start of the 2014 World Cup, brazil was the first time to score in the world cup (in their own goal oops!) and I learned how to create word clouds in R! Here is a tutorial on how to create word clouds in R with a world cup theme.


Whether you have a set of words already or you are interested in scraping data from social media sites such as Twitter, beautiful word clouds in R are only a few steps away with the help of some fantastic R-packages.


Set up Twitter authentication with R
If you are interested in obtaining a set of tweets with a hashtag (e.g. #worldcup), there are a few steps you must complete first.  As with all new relationships, it begins with a "handshake". This handshake is essentially a communication between you and and the Twitter server telling the two systems the type of information to be communicated. This entails the following five steps:

1. Go to https://dev.twitter.com and sign in using your twitter account.  Your picture will appear in the top right corner. Hover over the picture and click on My Applications.  If this is your first application, click on the Create a New App. Fill out the required application details which includes a Name, Description and Website.  None of this really matters, so just fill it in with whatever you wish.

2. Once you have created your app, you will see some details related to the OAuth Settings.  This will include a Consumer Key, Consumer secret, Request token URL, Authorize URL, Access token URL, Callback URL.  Keep all this information handy as you will need it in just a minute.

3. Load the Rcurl package and set the SSL certifications globally

library(RCurl)
options(RCurlOptions = list(cainfo = system.file("CurlSSL", "cacert.pem", package = "RCurl")))

4. Open up R or Rstudio and load the twitteR R-package

install.packages("twitterR")
library(twitteR)

5.  Once the twitteR package is loaded, type the following in R

reqURL <- "https://api.twitter.com/oauth/request_token"
accessURL <- "https://api.twitter.com/oauth/access_token"
authURL <- "https://api.twitter.com/oauth/authorize"
apiKey <- "yourAPIKey"
apiSecret <- "yourAPISecret"
twitCred <- OAuthFactory$new(consumerKey=apiKey,consumerSecret=apiSecret,requestURL=reqURL,accessURL=accessURL,authURL=authURL)
twitCred$handshake(cainfo = system.file("CurlSSL", "cacert.pem", package = "RCurl"))
registerTwitterOAuth(twitCred)

The yourAPIkey and yourAPISecret should be changed with your key found on your twitter application page.  The second to last step will ask you to go to a specific URL and enter the code found on the webpage in R.  If all went well, you have successful had a handshake with Twitter!


Get tweets using searchTwitter()
First, we can obtain a set of tweets containing a searchString. This searchString can be a hashtag or just a string of characters in quotations.  Here I will get a set of tweets containing the hashtag #worldcup.

mytweets <- searchTwitter("#worldcup", n = 100, cainfo = "cacert.pem")
length(mytweets)


Clean tweets using clean.tweets()
Load the following R-packages and extract the text portion from the tweet using getText():

library(tm)
library(wordcloud)
library(RColorBrewer)
library(plyr)
mytweets.text <- laply(mytweets, function(x) x$getText() )

Using a function clean.tweets() from this gist (originally obtained from here), we can remove invalid characters that cannot be analyzed.

clean_text = clean.tweets(tweets.text)


Create a word cloud using tweets
tweet_corpus = Corpus(VectorSource(clean_text))
tdm = TermDocumentMatrix(tweet_corpus, control = list(removePunctuation = TRUE, 
  stopwords = c("machine", "learning", stopwords("english")), 
removeNumbers = TRUE, tolower = TRUE))
m = as.matrix(tdm)
word_freqs = sort(rowSums(m), decreasing=TRUE)
dm = data.frame(word=names(word_freqs), freq=word_freqs)
wordcloud(dm[,1], dm[,2], random.order=FALSE, colors=brewer.pal(8, "Dark2")) 


Additional Resources


Tuesday, May 20, 2014

Inaugural Women in Statistics 2014: Highlights and Discussion Points

This week I attended the Women in Statistics conference which was held May 15-17 in the Raleigh-Durham area in North Carolina. I wrote a blog post prior to the conference and this is my follow up post. The theme of the conference was "Know Your Power" in which women discussed transformative moments in their lives and discussed ways to make positive changes in our field. To see more details on individual talks, you can search for tweets with the hashtag #WiS2014. The conference was filled with phenomenal talks/discussions, but I want to give a few highlights from the conference. 


[Pictured (bottom row, left to right): Stephanie Hicks, Jenna Krall, Alyson Wilson, Alicia Carriquiry]
[Pictured (top row, left to right): Cal Tate Moore, Rachel Schutt, Sally C. Morton, Samantha Tyner]

Here are a few key discussion points I took away from the conference:
  1. Social media (blogging, Twitter, LinkedIn, etc) is a great way to build a brand for yourself. Arati Mejdal gave several examples of statisticians and data scientists who have done this such as Hilary Mason (popular blog and twitter feed), Emma Pierson (recent graduate from Stanford who wrote a hilarious article on FiveThirtyEight showing people really just want to date themselves) and Andrew Gelman who says he uses his blog as a way to "steer statistics in a useful way". Two key points to make the most of social media are post regularly and actively comment / engage in discussions. As statisticians or data scientists, the best posts are visual and brief and they are different from academic articles (expert, but friendly).  
  2. Start networking now. Alicia Carriquiry gave a beautiful talk on how to build and nurture your professional network.  Some of the advice included: attend professional meetings, never turn down the opportunity to present your work, chat with people who have similar interests and those who have different interests, be willing to introduce yourself to people you would like to meet, create & practice your elevator pitch and get objective reviews of your performance early in your career.  If you are a young professor, invite other young professors from different departments to give talks and you may have the opportunity to do the same in their department. Jessica Utts (newly elected ASA president for 2016) said she came to "know her power" when she recognized the value of networking.  
  3. Do what makes you happy. It does not matter if your career takes you into academia, industry, government or a bit of all three: as Sally Morton said "Go where you will have the most impact and be most happy. If you are happy, that's where you'll be the most productive".  Rachel Schutt discussed how she did not know at the time how all the pieces of her career (e.g. graduate school, teaching, working at Google, professor Columbia University, etc) would come to fit together at current position. She just did what made her happy. Francesca Dominici led a discussion on Why women can't have it all? in which she stated "It is OK to want to spend time with your children. It OK to be passionate and committed about your work". She argued "a new definition of academic success should be defined to include rewards for teaching and mentoring".  No simple fix, but rather there needs to be a cultural change amongst both men and women to redefine the idea of "academic success". 
  4. The Imposter Syndrome is a real thing. Don't be discouraged by it, but rather recognize the problem if it's affecting you and focus your strengths. Focus on what you have accomplished versus the things you have not. The imposter syndrome is not the same thing as low self-esteem: low self-esteem is boosted when you have a success, but the imposter syndrome makes you feel more terrified if you have a success. For some additional thoughts on this, check out Lean In: Women, Work and the Will to Lead and The Confidence Gap
  5. Grace Wahba is simply a hero.  I'm not sure I could ever do her talk justice by trying to summarize it. I will say listening to her talk about her early career was a very surreal and a humbling experience. I feel fortunate to not have to face many of the challenges she faced, but listening to her talk was one of the highlights of the entire conference fore me!  I just encourage everyone to attend her COPSS Fisher Lecture at JSM August 6, 2014 at 4pm.  
Final thoughts: The conference was filled with enlightening talks from speakers of all backgrounds and of all ages who challenged the conference participants to "know your power" through sharing their own stories and experiences. These women are an inspiration and I know many younger women attending the conference felt very encouraged to take on the challenges that lie ahead of us.  I learned a great deal of professional and career development tools and felt men could have just as easily benefited from them too.  Thank you to the organizers and everyone who spent countless hours putting together an extraordinary conference.  I would highly recommend Women in Statistics to future participants!

I leave you with a few more pictures from the conference:

Panel of past and future presents of the American Statistical Association

Mixing and mingling at the poster session Friday night

A little bit of fun: superhero statisticians to the rescue (post-poster session)! 

Sally Morton sharing some of her experiences from the conference including her first "selfie" 

 The amazing Grace Wahba and her "Ah-ha" moments

Thanks to all sponsors.
Platinum: Duke U, NIGMS/NIH, ASA, Minerva Research Foundation, Walmart
Gold: IBM, Lowe's
Silver: Biogen Idec, Experian, Lilly, Minitab, Morestream, SAS
Bronze: Berry Consultants, Cytel, JMP, Nielsen, NC State, Rho, RTI, Stata, UNC, Westat

Wednesday, May 14, 2014

The inaugural Women in Statistics Conference

This week is the inaugural Women in Statistics Conference being held May 15-17, 2014 in Cary, North Carolina. This conference is targeted at women at varying stages starting from graduate school all the way through tenured professors or well-funded CEOs in industry.  As a female statistician (and a postdoctoral fellow), I am very excited to attend this conference celebrating women in statistics!  Here are a few of the reasons why: 
  1. The opportunity to listen to and to interact with an entire community of female statisticians from industry, academia & government is one of the most attractive aspects of this conference. Not only will these talks/breakout sessions focus on a diverse set of career opportunities, they will also focus on useful topics on how to obtain these positions e.g. Answering tricky interview questions, Things I wish I knew when I started working, Optimizing your job search, How to negotiate what you are worth, The value of internshipsPreparing for promotion in academia, etc. These are all topics both men and women in our field can benefit from, so I plan to create a second blog post summarizing ideas/notes that are relevant for the entire statistical community.  
  2. Statistics as a discipline is currently facing its own set of challenges within the larger community of Science, Technology, Engineering and Mathematics (STEM), one including being able to attract women to the STEM fields. Many people have suggested ideas and discussed reasons why this is happening. I cannot speak for other women, but I can say one of the reasons why I am I where I am today is the copious amount of support that I have receieved from not only my family and friends, but most importantly from my mentors, faculty advisors and peers.  I was fortunate enough to not have "a terrible graduate school experience", but rather one filled with mentoring, guidance and patience. I know this conference will also be filled with mentoring and guidance from other female statisticians, many of which I consider to be role models. Conferences like this provide women with the information and tools needed to thrive not only in statistics, but in the larger STEM fields as well.  
  3. The idea of gender inequality in the field of statistics is not a new story, but it has been recently discussed in several articles. Ingram Olkin and Terry Speed both discussed the fact that at JSM 2012 "of the four named lectures (i.e. Wald, Rietz, Neyman, Fisher), the seven medallion lectures, and the two invited lectures, none of them were women". Amanda Golbeck wrote an Op-ed titled Where Are the Women in the JSM Registration Guide? in which stated "a productive way to help recruit, retain and nourish women professionals is to provide strong role models for them".  I completely agree and this conference will discuss several of these issues in talks and breakout sessions on topics such as Increasing Visibility of Women in Statistics, Increasing the Number of Women AwardsRecruiting and Retaining Women and Minorities in Statistical Science, Women in Science: Contributions, Inspirations, and Rewards, and Finding Our Place in History: Decades of Women Pioneers and Trail Blazers to name a few.  
  4. I'm particularly excited about the Internet Activism: Using social media to enhance your career breakout session. I learned this idea of using social media as tool to keep up with the literature & make a internet presence for yourself fairly late in my graduate school career. It's a way academic departments and industries can learn about your research interests and contributions.  I know the use of social media has absolutely transformed the way I function as a researcher. I was introduced to this idea actually from the genetics/genomics community by attending the American Society of Human Genetics for the past several years.  I think statisticians haven't quite caught on to the social media bug like the world of genomics, but as statistics departments are grappling with the debate of adsorbing statistics into incredibly popular emerging field of "data science", this is a topic I think many statisticians would find particularly useful.  
In addition, I have been asked to lead a discussion on Taking on Leadership Positions on Saturday morning.  I thought about what questions might be the most useful to ask and here are a few ideas that I have come up with:
  1. What defines a good leader? Is it innovation, focus, communication, ability to hire creative people with diverse backgrounds, ability to risk failing?  Some articles I found relevant were the Harvard Business Review put out an article on Real Leadership Lessons of Steve Jobs and the Forbes Women Leaders Must Dive In, Not Just Lean In. What other articles are good reference points? 
  2. Who are some examples of great leaders inside or outside the field of statistics? 
  3. What are some examples of positions require leadership skills inside or outside the field of statistics?  What do these positions have in common? 
  4. In what ways might someone who does not have an innate ability to lead learn to lead?   Are the qualities (from Q1) usually inherited or can they be learned?  
  5. What are the different styles of leaders? 
  6. How do you balance a position of leadership and maintain a balanced life either with your research and/or family life? 

I welcome other thoughts/suggestions! I plan to live tweet as many talks/breakout sessions as I can (you can follow me @stephaniehicks), but I will definitely write a second blogpost summarizing my thoughts and key points taken away from the conference.  

Thursday, February 6, 2014

Creating A New Ground for 'Data Science' outside of just Statistics or Computer Science

In a recent AMSTAT News article, Terry Speed wrote a fantastic and inspirational article on the field of statistics.   He began by summarizing some themes from the IYS 2013 "The Future of Statistical Science" workshop he attended.  Some themes he noted were "what an excellent job statisticians are doing" particularly in the areas of "genomics, cancer biology, the study of diet, the environment and climate, in risk and regulation, neuroimaging, confidentiality and privacy and autism research" but saw a lack of representation from "social, agricultural, government, business and industrial statistics".

He openly acknowledged our field of statistics faces many challenges (I direct you to the link for the complete list). In particular: (1) statistics departments are grappling with the debate of adsorbing statistics into incredibly popular emerging field of "data science" and (2) statistics departments are not able to deliver the type of graduates that companies such as Google, Apple, Amazon want which "perhaps involves adopting a more engineering approach to our work".  Yet, students across the world are seeking out majors and/or courses in statistics and "data science" through many different venues e.g. taking courses at a universities, via MOOCs, or online tutorials, etc. Should Statistics be renamed "Data Science"? What is the overlap? What is the best way to train "Data Scientists"?

Terry's response was essentially that data science is not the same as statistics and he saw "no evidence that data science ... has any prospect of replacing our discipline" because statistics "is far wider and deeper than data science".  He encourages statisticians to embrace this emerging field of data science and not fear it: "As with mathematics more generally, we are in this business for the long term. Let's not lose our nerve."

These ideas were all echoed at a symposium I attended last Friday called 'Paths to Precision Medicine: The Role of Statistics' hosted by the Department of Biostatistics at Harvard School of Public Health. At the end of the symposium, there was a panel discussion on 'Education of Future Statisticians in the Big Data Era' with Giovanni Parmigiani, Corsee Sanders, Rafael Irizarry and Marc Pfeffer as the panelists.

Giovanni said when transformations in technology occur, this is a characteristic of the "Big Data Era" and no single field is able to take on "Big Data" as a whole by saying this is a subset of what they do (similar to the argument made by Terry).  Not computer science. Not electrical engineering.  Not statistics. When it comes to creating a curriculum to train individuals who are seeking to become "data scientists" in the Big Data Era, he says we should "teach less and do more".  Rather than starting with a predefined idea of what we should be teaching and/or adding more things to a curriculum for "data science", we should let these individuals dive right into projects as early as possible (with mentorship!). This will also help develop essential skills such as communication and teamwork which cannot be taught in the classroom.

Furthermore, Rafa proposed creating a new, uncharted territory between statistics and computer science to provide the training to individuals who are seeking to become data scientists with as much emphasis as the individuals want in the direction of statistics, computer science or other fields.  This will more than likely require faculty to step out of their comfort zone and even possibly connect with faculty outside their department to jointly teach a course. When it comes to data science, there are many people who believe data science is more about the computing than the statistics and others who would emphasize the statistics more than the computing.  Regardless of the degree of emphasis of various fields on data science, the one thing I do know is that I agree with Jeff Leek's view that "the key word in 'Data Science' is not Data, it is Science".  We should be emphasizing the science (whether it is statistics, computer science, hacking skills, etc) in our curriculums for data science and allow the students to have an opinion in how diverse of a training they want.  As Rafa said, "the faculty in statistics and biostatistics departments are becoming increasingly more diverse and we should make these graduate students more diverse too."

Thursday, January 9, 2014

Easy introduction to meta-analyses in R

My incredibly intelligent younger sister is in the middle of her third year of a PhD program in clinical psychology.  While I have always considered myself to be logical, analytical and drawn to the more science and math-oriented topics, she has always been more artistic, intuitive and definitely the writer in the family.  Part of her curriculum has included several statistics courses (which she aced!) so you can imagine the statistician in me is beaming with pride!

Recently, she has started searching for potential thesis topics and mentioned meta-analyses were particularly interesting to her.  To help her and hopefully other non-statisticans who are interested in performing a meta-analysis, I have put together a short tutorial to run a simple meta-analysis in R.

Performing a search for the words 'meta-analysis' or 'meta analysis' on CRAN and Bioconductor currently yields 34 and 6 available R packages, respectively. Some are meant for a specific type of data (e.g. genomic data such as microarrays), but in general the majority of these R packages are meant for combining summary statistics of discrete or continuous data extracted from a set of carefully selected published studies.  

Before starting a meta-analysis, there are many important questions to be answered such as
  1. How to pick which studies to include in the meta-analysis? What are possible biases in selecting the studies?
  2. What effect are you interested in measuring? What data needs to be extracted from the papers? 
  3. What type of meta-analysis should be performed? 
  4. What software tools/packages are available to perform a meta-analysis? 
  5. How do I interpret the results from the output of the software tool used? How do I know if the meta-analysis yielded anything statistically valid and significant?
I want to preface this tutorial with the statement: the first two questions are extremely important and should be answered before starting any meta-analysis.  Because an entire course could focus on meta-analyses, I've limited the focus of this tutorial to discussing the last three questions: (1) basic types of meta-analyses, (2) statistical tools/packages available to perform the meta-analysis and (3) interpreting the results.   

Generally speaking there are four types of meta-analyses: 

  • univariate meta-analysis
    • n studies comparing two treatments (e.g. case/control) with a dichotomous outcome
  • multivariate meta-analysis
    • n studies comparing two treatments with multiple outcomes
  • meta-regression
    • n studies comparing two treatments with a dichotomous outcome but can investigate the impact of additional "moderator" or explanatory variables (e.g. year of study) on the outcome
  • network meta-analysis (also known as multiple treatment meta-analysis)
    • n studies comparing multiple treatments with a dichotomous outcome
All of these types of meta-analyses can easily be run in R with freely available packages such as meta, mvmeta, mvtmeta, metafor, rmeta and getmtc.   

For example, here is a brief summary of the meta R package 
  • Description: Simple package to estimate fixed-effects and random-effects models for binary and continuous data in a univariate meta-analysis. Meta-regression is also available. 
  • Documentation: http://cran.r-project.org/web/packages/meta/index.html
  • Useful Notes: Use metabin() for binary data and metacont() for continuous data.  Using continuous data, can estimate mean difference and using binary data, can estimate risk ratio, odds ratio, risk difference and arcsine difference using "sm = " argument.  Try print()summary()forest()funnel() and labbe()metabias() for analyzing the results from the meta-analysis. Use metareg() for meta-regression.
Simulated data example
Consider a univariate meta-analysis with n = 10 studies comparing two treatments (drug A and drug B) and a dichotomous outcome (e.g. death, no death).   Estimate an overall odds ratio of the death in the drug A group relative to the drug B group.  

In the first study, 109 individuals were in the control group who received drug A and 107 individuals in the case group who receive drug B.  Out of the 109 individuals who received drug A, 14 individuals died compared to 52 individuals who received drug B.  The odds ratio for study 1 is 6.42 with a 95% confidence interval of (3.26, 12.63) which is statistically significant.  Below is a forest plot of all the studies used in the meta analysis.


Based on the simulated data, the odds ratio of death using drug B relative using drug A is 8.15 which is statistically signifiant because the 95% confidence interval of (6.44, 10.30) using a fixed-effects model does not contain the value 1.

For a further discussion on the differences between a fixed-effects and random-effects model, Wikipedia has a fairly easy to understand description of the differences.  The main thing to understand is if your studies are considered to be "heterogeneous", then you will need to use a random effects model.  Otherwise you should use a fixed effects model.  The way to test which model to use is with the Cochran Q test or the $I^2$ test.  In the forest plot, the $I^2$ test was performed in which the null hypothesis is there is no study heterogeneity and the fixed effects model should be used.  Because the p-value (p = 0.6586) was greater than an a  $\alpha$ confidence level of 0.05, we fail to reject the null hypothesis and use the fixed effects model for the meta-analysis.

For an overview of the R packages CRAN has to offer, a Task View dedicated specifically to meta-analyses is available. Another good resource is from the 2013 UseR conference.  
Note: there are also many other software tools available outside of R which may be of interest: MetaEasy in Excel and similar functions in Stata, SPSS and SAS.