Showing posts with label statistics. Show all posts

Friday, October 12, 2018

Statistics, we still have a problem and we need your help

One year ago, the #MeToo movement to increase awareness about sexual harassment and sexual assault began. The field of Statistics was no exception. Eleven months ago, the American Statistical Association board of directors approved the formation of a Task Force on Sexual Harassment and Assault. Ten months ago, Kristian Lum published a blog post titled Statistics, we have a problem where she called for our community to stop tolerating a culture of harassment with the hope that her story will help other women come forward who have been affected by sexual harassment or assault (and she’s not the only one). The day after I read Kristian’s blog post, I decided to organize a panel session at the largest statistics meeting (annual) in North America (Joint Statistical Meetings) on Addressing Sexual Misconduct in Statistics, which took place in Vancouver, Canada in August 2018.

A common theme that was echoed by both the panelists and audience was that it would be great if we could identify effective strategies to promote an inclusive, equitable culture, free of gender bias and sexual harassment. While we, as a community up until now, have primarily focused on the negative, downstream effects of what happens in a culture that does not value women, I would argue that what we should be focused on is how to identify, discuss, and encourage strategies that promote a positive culture. 

Why this is extremely important? 

Last week, the New England Journal of Medicine published an article titled Men’s Fear of Mentoring in the #MeToo Era — What’s at Stake for Academic Medicine? The article stated: 
“In response [to the #MeToo movement], some men in positions of power now say they are afraid to participate in mentoring relationships with women. In a study focused on engaging men in gender-equity initiatives, 74% of male senior business managers cited fear as a barrier to men’s support for gender equity. A 2018 survey of nearly 3000 employed U.S. adults found that some men have stopped meeting alone with women, and others will not meet with women they do not know well or who are considered to be their subordinates. Men say they fear false allegations of sexual misconduct that could compromise their reputations and end their careers, even if they were found to be innocent.
This has serious repercussions and consequences for women who are looking to advance their careers:
Being denied mentorship relationships deprives young women of career-enhancing experiences during critical periods of their professional development… In medicine, where female leaders are few — women represent nearly half of medical school graduates yet only 16% of deans — denying women access to mentoring relationships will perpetuate this gender gap.”
The field of academic statistics is similar. I have heard first-hand from many of my male peers that they too worry about false allegations of sexual misconduct, to the point that they have now altered the way they interact with their female students (e.g. no longer taking meetings outside of the office, such as meeting for coffee), but continue to provide these opportunities to their male students. My concern is not with the idea of meeting outside the office (that is a healthy discussion to have and by no means a straightforward discussion, for example, it can vary across cultural and religious norms), but rather the concern is with the discrepancy in mentorship between female and male students. 

This is extremely distressing to me because I wholly understand the loss of mentorship to women in the statistics community that will now happen if we don’t start discussing effective strategies to promote a positive culture and training on how implement those strategies. As a student and trainee, I was fortunate enough to have wonderful mentors (both male and female). I saw first hand that many, insightful conversations about career development often happens outside of the office (e.g. meeting a coffee shop or a conference). Had my mentors thought similarly to the 74% male managers above, I’m not sure I would have made it through the 14 years of post-high school education and training to get where I am today. We need young, female students and trainees to have access to good mentors (male or female) and male mentors to feel like they can successfully mentor women without feeling threatened of false accusations. While my male peers are sympathetic and would like to encourage further progress, I frequently hear it can be difficult to figure out where to start. 

What can you do to help? 

My call to action is that we need to identify effective strategies for promoting an inclusive and equitable culture for women and provide education and training to both men and women on how to successfully implement those strategies. This includes senior leadership in our community dedicating protected time for these discussions and training in our own work environments and at professional events.

This August, I submitted an invited panel session proposal to JSM for 2019 to “highlight innovative efforts by statisticians who have actively sought to positively change culture in their work environment and through local, national, and international platforms in the fields of statistics and data science. The panelists’ major objective is to discuss specific strategies on how to make a positive culture in our community. The ultimate goal for this session is that audience members will be able to implement strategies described by the panelists in their own work environment to change the culture in a tangible way.” The panelists stemmed from academia, government, non-profit and industry:
  • Wendy Martinez -- ASA President-Elect in 2019 and Director of the Mathematical Statistics Research Center at the Bureau of Labor Statistics
  • Emma Benn -- Assistant Professor of Biostatistics and Director of Academic Programs at the Icahn School of Medicine at Mount Sinai, and a member of the ASA Task Force on Sexual Harassment and Sexual Assault.
  • Debashis Ghosh -- Professor and Chair of the Department of Biostatistics and Informatics at the Colorado School of Public Health
  • Karthik Ram -- Senior Scientist at the Berkeley Institute for Data Science at UC Berkeley and co-founder of rOpenSci, a non-profit initiative to make scientific data retrieval reproducible
  • Jennifer Hecht -- Vice-President People Operations at RStudio with extensive experience in human resources in industry 
  • Gabriela de Queiroz -- Sr. Developer Advocate at IBM and Founder of R-Ladies, a non-profit, international organization to increase the gender diversity in the R community
While the proposal was not selected, I plan to submit it as a topic-contributed session. In the meantime, I decided it was important to start discussing this now (hence this blog post). 

Yes, Statistics, we still have a problem, but we will soon have an even bigger problem if we lose young, incredibly talented, female students and trainees because of discrepancies in training or completely insufficient mentorship. 

Questions, comments? Feel free to reach out to me by email or twitter.

Friday, August 17, 2018

How to successfully submit a conference session proposal

Conferences are a wonderful place to learn about exciting research happening in your field, to meet new people and/or potential collaborators and to catch up with old friends. Recently, I attended the annual Joint Statistical Meetings (JSM) in Vancouver, Canada, which is the largest conference for statisticians in North America. One of the features of this conference is the program committee invites anyone to submit a proposal for an Invited Session. In terms of JSM, the due date is almost a year in advance of the conference. For example, Invited Session proposals for JSM 2019 (July 27-Aug 1, 2019) are due September 6, 2018. There are also other types of sessions called Topic-contributed Sessions and Contributed Sessions with due dates a bit later in the year. The problem is because this conference is so large, it requires a long time to read through the proposals and to organize all the sessions.

In previous years, I helped organize and participated in an invited session at JSM. This year, I submitted a proposal for a topic-contributed session, but it was elevated to a late-breaking session. Most recently, I organized an Invited Session, which was just accepted, for the 2019 Eastern North American Region (ENAR) International Biometric Society conference. Finally, I am on the program committee for the 2019 Symposium on Data Science and Statistics (SDSS).

Given my recent experiences organizing sessions for conferences and the JSM 2019 Invited Session proposals are due in a few weeks, I thought I would it would be relevant to write a blog post on strategies I use when putting together a proposal.

1. Come up with a interesting, timely and relevant topic. You might bounce ideas off of your colleagues to see if the topic would have wide enough interest and might be of interest or be relevant to a particular conference. This is often the most difficult part of organizing a session. If your topic is not really of interest to a wide enough audience, it is highly unlikely that it will be selected. However, you want it to be focused enough that you can reasonably talk about the topic in 1-2 hours.

2. Create a title and abstract for your session proposal. If you have thought carefully about the topic, this should be an easier step. The title should be succinct and representative of what you want your session to be about. The abstract should contain (1) why this topic is important and relevant, (2) the focus and goal of the session, (3) what the speakers will discuss. Ask a colleague to review the title and abstract to give you feedback.

3. Decide on speakers and send out invitation emails. First, think carefully about who is in your audience and who you want to invite. Some things to think about when coming up a list of potential speakers: their backgrounds, their expertise, their perspective, their ability to give good presentations and the diversity of the speakers. The last one is most commonly overlooked, but can bring such rich and valuable discussions if you have a diverse set of speakers.

Here is a suggested format to send the invitation emails:

Hi ____, 

I am organizing a <add name of session> session for the <add name of conference> conference in <add location> next year. The session will be focused on <add topic of session>. 

My goal with this session is for <add goal of session>. Instead of focusing on <a previously discussed topic>, I want to focus on <a new topic>. My hope for the session is that audience members will be able to <add what you want the audience to get out of the session>. 

As the <add the person's title, etc>, I would like to invite you to speak in the session <(or) join as a panel member to share your insight and perspectives (if a panel)>. Your expertise in <all the reasons why this person would be a good speaker> would be highly valuable and a great contribution to the session. 

I hope you will join the session if you plan to attend and aren’t otherwise committed. Could you let me know by <fill in the date> if you would be willing to speak? I plan to include 3-4 speakers <(or) panel members> and welcome suggestions for additional speakers. 

I am happy to answer any other questions that you may have. 

All the best, 
<add your name here>
<add your affiliation here>

Some will say yes, some will say no. If needed, send out more email requests. The main things are to explain (1) the details of the conference and session, (2) the focus and goal of the session, (3) why you are inviting them or why you think they would be a good contribution to the session, (4) and the date you need for them to respond to you by.

4. Submit a proposal to the conference by the due date. This usually includes at minium a title and an abstract. You also want to include the name of all the speakers who have agreed to participate in your session, their affiliations (departments / institutions / company name, etc), and usually an email address. This helps the conference organizers get a better idea of what will be discussed. This last one is often required, so check out what is needed for your specific conference.

5. Wait for a response from the conference organizers. This can be a quick or very long process, depending on how large the conference is. Typically the larger the conference, the longer it takes to go through all the proposals. JSM's Invited Session proposals are notoriously long:

And my favorite response from the amazing Shannon Ellis:

If your proposal is accepted, CONGRATULATIONS! Send an email to all the speakers to share the good news. They will need to register and may need to submit individual abstracts for each of their respective talks. Remind the speakers of any upcoming deadlines. If not, consider trying again next year!

Most importantly, if you are a student or postdoc, organizing a conference session can be a fantastic way to meet people in your field! You have the opportunity to craft a session on a topic that excites you the most and chair that session. Conferences need fresh perspectives and new ideas, and I find students and postdocs actively working on a research topic have some of the most insightful suggestions.

Wednesday, June 6, 2018

Addressing Sexual Misconduct in Statistics

The cultural revolution from the recent #metoo movement has demonstrated that sexual harassment and sexual assault are far too common and often go unreported in professional settings, including in the field of Statistics. In response to this, I have organized a late breaking session at the Joint Statistical Meetings on Addressing Sexual Misconduct in Statistics on Monday July 30, 2018 2-3:50pm in Vancouver, Canada.

The focus of this session is to bring together seven panelists to discuss how sexual misconduct can negatively impact the careers of the victims and how we as a community can make positive changes. Our goal is to open the dialogue on recognizing and condemning predatory sexual behavior, and provide support and inclusion to all members of the statistics community.

This session will be a positive discussion to address this topic and will offer perspectives from conference participants, elected leaders of professional societies, academic journal editors, academic department chairs, and program committee members. In addition, this session will also include the perspective of individuals who have been directly impacted by sexual harassment or assault, which is particularly relevant to other individuals in the audience who have also been impacted by sexual harassment or assault, but may not have discussed it publicly. Keegan Korthauer will chair the session and our panelists will include:

If you are planning on attending #JSM2018, I invite you to join us.  

Friday, February 9, 2018

Lessons learned from applying for scholarships

As a graduate student (many moons ago), I applied for the Gertrude M. Cox Scholarship from the American Statistical Association. The purpose is "to encourage more women to enter statistically oriented professions". I was a woman pursing a PhD in Statistics and wanted to enter a statistically oriented profession, so I wrote an essay and submitted an application. In the essay, I explained how I got interested in statistics and why I decided to pursue a PhD. At the time, I did not have many examples of "acts of leadership", but I had done some community service and/or mentoring as an undergraduate student. Afterwards, I was sad to find out I was not selected. However, forcing myself to go through that process taught me a few general lessons when applying for scholarships (and more general things e.g. grants, papers) that have stuck with me over the years. I figured it might be worth sharing them here.

  1. As a student, it is easy to feel like your resume/CV is sparse or you do not have much to write about. You may have started a graduate program right after completing your undergraduate degree without any work experience. You may still be taking a lot of classes or not have much teaching experience. You may be early in your graduate program without any research experience or peer-reviewed publications. What is most important is your ability to communicate why you are interested in your area, why it is exciting, and why others should be excited about it. If you have done work or made contributions in the area, great. Write about it. However, as someone who now reviews applications for a full-tuition scholarship for women interested in STEM funded by Cards Against Humanity I believe it is much more important to say why you are passionate by whatever you are interested in, irrespective of how much you may or may not have accomplished. 
  2. Recommendation letters matter. You want to ask individuals who really know you. If you ask a professor who only knows that you made an A in their class and can't say much more, that comes across loud and clear in the recommendation letter. You want to ask individuals who will actively advocate for you. 
  3. Rejection is part of life and do not it deter you from pursing your passions or dreams. I will be honest: I am still struggling with this one even to this day. However, it has gotten easier over the years because I have learned to not take it personally. But seriously, some days I want to scream at the top of my lungs 'WHY DIDN'T YOU PICK ME? WHY DIDN'T YOU SELECT MY GRANT? WHY DIDN'T YOU ACCEPT MY PAPER?', etc. During those moments, I just remind myself I only have control over the next award I apply for, the next paper I submit, the next grant I write. 
Anyways, if you are woman in a full-time graduate Statistics program (MS or PhD) and a citizen or permanent resident of the US or Canada, I would encourage you to apply for the Gertrude M. Cox Scholarship. Applications are due two weeks from today (February 23, 2018). For what it's worth, I posted my (unsuccessful) application essay for the scholarship. Maybe it will help someone else write their essay! 


Friday, July 29, 2016

Attending JSM Conference 2016 in Chicago

This weekend I'm headed to Chicago to the big, annual conference for statisticians in North America: the Joint Statistical Meetings (JSM). I'll be there Sunday through Wednesday afternoon and I'm giving a talk on Tuesday in Session #405 titled 'Statistical Challenges in the Analysis of Single-Cell RNA-Seq Data'. In preparation for the conference, I started a set of notes on GitHub of the sessions I'm mostly interested in attending. As I attend various sessions, I'll add more notes of software, papers and links from the talks.  Looking forward to catching up with some old friends and meeting new friends!

Wednesday, April 8, 2015

Influential works in Data-Driven Discovery

A recent initiative to fund data-driven discoveries was completed last year by the Gordon and Betty Moore Foundation. Over 1,100 applications were received and each application had the opportunity to cite five "influential works in the general field of 'Big Data' for scientific discovery".  An analysis was done to see which works were cited the most and in what genres these works were from.  A paper summarizing the results was posted on arXiv on March 30, 2015 and had some interesting results that I wanted to share!

First, I was happy to see I have read several of the most cited influential works, but this also gave me a nice summer reading list of things I haven't read (I think this will basically be my #tbt (throwback Thursday) data-science papers for the next year)!  It was such a great list of works that I wanted to share the most cited influential works on here (each cited at least 10 times):

  1. MapReduce [Dean and Ghemawat, 2008] - 63 (citations)
  2. Fourth Paradigm [Hey et al., 2009] - 51
  3. Elements of Statistical Learning [Hastie et al., 2009] - 43
  4. Initial sequencing of the human genome [Lander et al., 2001] - 30
  5. A mathematical theory of communication [Shannon, 2001] - 24
  6. Sloan Digital Sky Survey [York et al., 2000] - 23
  7. BLAST [Altschu et al., 1990] - 20
  8. Lasso [Tibshirani et al., 1996] - 19
  9. Latent Dirichlet allocation [Blei et al., 2003] - 19
  10. EM algorithm [Demster et al., 1977] - 17
  11. Support vector networks [Cortes and Vapnik, 1995] - 17
  12. Random forest [Breiman, 2001] - 15
  13. Pattern Recognition [Bishop et al., 2006] - 14
  14. Anatomy of web search engine [Brin and Page, 1998] - 14
  15. Numerical Recipes [Press, 2007] - 13
  16. Boostrap methods [Efron, 1979] - 11
  17. Equation of state calculations [Metropolis et al., 1953] - 11
  18. Exploratory data analysis [Tukey, 1977] - 11
  19. Probability reasoning [Pearl, 1988] - 11
  20. PageRank [Page et al., 1999] - 10
  21. Bayesian Data Analysis [Gelman et al., 2013] - 10
  22. Unreasonable effectiveness of data [Halevy et al., 2009] - 10
Other cool things about this article:
  • The R programming language and the IPython Notebook programming environment were highlighted. The authors state the "R language is one of the leading programming languages, and was referenced a significant number of times".  Similarly, the IPython Notebook "is noteworthy as one of the few open source software toolkits for both programming and data analysis that is not database, algorithm or programming language". 
  • Classic/foundational ideas such as Bayes Theorem, Metropolis-Hastings Algorithm, lasso, bootstrap, Expectation-Maximization (EM) Algorithm were sprinkled throughout the article. These ideas are almost standard in any statistics curriculum and are incredibly powerful and useful tools when analyzing data. 
  • The concepts of 'exploratory data analysis' (EDA) and 'data visualization' got a major shout out with Tukey's and Tufte's essential works.  These concepts are critical in the analysis of data and are often overlooked or treated as assumed knowledge.  I would argue that these concepts should be included as a major portion of any course based around teaching the concepts of data analysis.  

So, how many have of these have you read??

Monday, November 3, 2014

Halloween Trick-or-Treaters as a Poisson Process

Usually this time of the year I'm blogging about some Halloween-themed cookie recipe or jack-o-lanterns (and roasted pumpkin seeds yum!). This year I thought it would be fun to discuss the idea of a Poisson process and use Halloween as an example.  In this blogpost, I will simulate the number of trick-or-treaters as a Poisson process!


Generally speaking, a Poisson process is a continuous-time process ${N(t), t \geq 0}$ where $N(t)$ counts the number of events that occur in a time interval [0, $t$] and the inter-arrival time of these events in a given time interval. In our case, we can think the Poisson process counting the number of trick-or-treaters in a given time interval. Specifically a Poisson process is characterized by the following properties:
  1. The number of events at time $t$ = 0 is 0 (or $N(0) = 0$)
  2. Stationary increments: the probability distribution of $N(t+h) - N(t)$ depends only on $h$ (not $t$). This means the probability of observing a certain number of trick-or-treaters in a given time interval depends only on the length of the time interval (e.g. 1hr).  
  3. Independent increments: the number of events occurring in disjoint time intervals are independent of each other. You can think of this as the number of trick-or-treaters we see from e.g. 5:30-6:30pm doesn't influence the number of trick-or-treaters we see e.g. 7:30-8:30pm. 
  4. $N(t)$ is distributed as a Poisson distribution.  
Assuming these four properties, we immediately get a free piece of information:
  • Inter-arrival times between the events (or "waiting times") are independent and identically distributed as an exponential random variable with a given rate parameter. Therefore to simulate a Poisson process all we have to do is simulate the inter-arrival times between events using an exponential distribution.  
Now, there are several types of Poisson processes, but for our purposes I will discuss on two: (1) a homogeneous and (2) inhomogeneous Poisson process. The main difference between the two is the rate at which the events occur.  In the homogeneous Poisson process events occur at a constant rate $\lambda$.  In the inhomogenous Poisson process, events occur at a variable rate $\lambda(t)$.  
  • homogenous Poisson process: 
    • The probability of one event in a small interval $h$ is approximately $\lambda h$ where $\lambda$ is a rate parameter. The probability of two events in a small interval is approximately 0.
$$N(t) \sim Poisson(\lambda t)$$
$$P[N(t + s) - N(t) = k] = \frac{e^{-\lambda s} (\lambda s)^{k}}{k!}$$

If we define $S_k$ as the arrival time of the $k^{th}$ events and $X_k = S_k - S_{k-1}$ as the time between the $k^{th}$ and $k-1$ arrival time, then 

$$P(X_k > t | S_{k-1} = s) = e^{-\lambda t}$$
  • inhomogenous Poisson process: 
    • The difference is here the rate parameter varies over time: $\lambda(t)$.  This means we no longer have stationary increments as above because the number of events observed in a given time interval depends on the length of the interval AND the time $t$ itself.  
Let's try an example. Let's simulate the number trick-or-treaters using a homogeneous Poisson process with rate parameter $\lambda$. Using this blogpost as an estimate for the number of trick-or-treaters per minute, I estimated there are 1-2 trick-or-treaters per minute.  As stated above, to simulate the Poisson process, I will simulate the inter-arrival times of the trick-or-treaters using an exponential distribution. The cumulative distribution function of an exponential random variable $T$ is given by

$$u = F(x) = 1 -e^{-\lambda t}$$

As a little background reading, here are two sets of notes on simulating a Poisson process which are particularly useful: here and here.  If the hours for trick-or-treating are around 5:30-8:30pm, the inter-arrival times $X_k$ can be simulated $u \sim U[0,1]$, then we can solve solve for $t$:

$$t = - \frac{\log(u)}{\lambda}$$


One nice extension of this example would be to an inhomogeneous Poisson process where the rate at which the trick-or-treaters arrive varies across time.  I'll leave it to you to try.  Hope everyone had a safe and happy Halloween!


Tuesday, May 20, 2014

Inaugural Women in Statistics 2014: Highlights and Discussion Points

This week I attended the Women in Statistics conference which was held May 15-17 in the Raleigh-Durham area in North Carolina. I wrote a blog post prior to the conference and this is my follow up post. The theme of the conference was "Know Your Power" in which women discussed transformative moments in their lives and discussed ways to make positive changes in our field. To see more details on individual talks, you can search for tweets with the hashtag #WiS2014. The conference was filled with phenomenal talks/discussions, but I want to give a few highlights from the conference. 


[Pictured (bottom row, left to right): Stephanie Hicks, Jenna Krall, Alyson Wilson, Alicia Carriquiry]
[Pictured (top row, left to right): Cal Tate Moore, Rachel Schutt, Sally C. Morton, Samantha Tyner]

Here are a few key discussion points I took away from the conference:
  1. Social media (blogging, Twitter, LinkedIn, etc) is a great way to build a brand for yourself. Arati Mejdal gave several examples of statisticians and data scientists who have done this such as Hilary Mason (popular blog and twitter feed), Emma Pierson (recent graduate from Stanford who wrote a hilarious article on FiveThirtyEight showing people really just want to date themselves) and Andrew Gelman who says he uses his blog as a way to "steer statistics in a useful way". Two key points to make the most of social media are post regularly and actively comment / engage in discussions. As statisticians or data scientists, the best posts are visual and brief and they are different from academic articles (expert, but friendly).  
  2. Start networking now. Alicia Carriquiry gave a beautiful talk on how to build and nurture your professional network.  Some of the advice included: attend professional meetings, never turn down the opportunity to present your work, chat with people who have similar interests and those who have different interests, be willing to introduce yourself to people you would like to meet, create & practice your elevator pitch and get objective reviews of your performance early in your career.  If you are a young professor, invite other young professors from different departments to give talks and you may have the opportunity to do the same in their department. Jessica Utts (newly elected ASA president for 2016) said she came to "know her power" when she recognized the value of networking.  
  3. Do what makes you happy. It does not matter if your career takes you into academia, industry, government or a bit of all three: as Sally Morton said "Go where you will have the most impact and be most happy. If you are happy, that's where you'll be the most productive".  Rachel Schutt discussed how she did not know at the time how all the pieces of her career (e.g. graduate school, teaching, working at Google, professor Columbia University, etc) would come to fit together at current position. She just did what made her happy. Francesca Dominici led a discussion on Why women can't have it all? in which she stated "It is OK to want to spend time with your children. It OK to be passionate and committed about your work". She argued "a new definition of academic success should be defined to include rewards for teaching and mentoring".  No simple fix, but rather there needs to be a cultural change amongst both men and women to redefine the idea of "academic success". 
  4. The Imposter Syndrome is a real thing. Don't be discouraged by it, but rather recognize the problem if it's affecting you and focus your strengths. Focus on what you have accomplished versus the things you have not. The imposter syndrome is not the same thing as low self-esteem: low self-esteem is boosted when you have a success, but the imposter syndrome makes you feel more terrified if you have a success. For some additional thoughts on this, check out Lean In: Women, Work and the Will to Lead and The Confidence Gap
  5. Grace Wahba is simply a hero.  I'm not sure I could ever do her talk justice by trying to summarize it. I will say listening to her talk about her early career was a very surreal and a humbling experience. I feel fortunate to not have to face many of the challenges she faced, but listening to her talk was one of the highlights of the entire conference fore me!  I just encourage everyone to attend her COPSS Fisher Lecture at JSM August 6, 2014 at 4pm.  
Final thoughts: The conference was filled with enlightening talks from speakers of all backgrounds and of all ages who challenged the conference participants to "know your power" through sharing their own stories and experiences. These women are an inspiration and I know many younger women attending the conference felt very encouraged to take on the challenges that lie ahead of us.  I learned a great deal of professional and career development tools and felt men could have just as easily benefited from them too.  Thank you to the organizers and everyone who spent countless hours putting together an extraordinary conference.  I would highly recommend Women in Statistics to future participants!

I leave you with a few more pictures from the conference:

Panel of past and future presents of the American Statistical Association

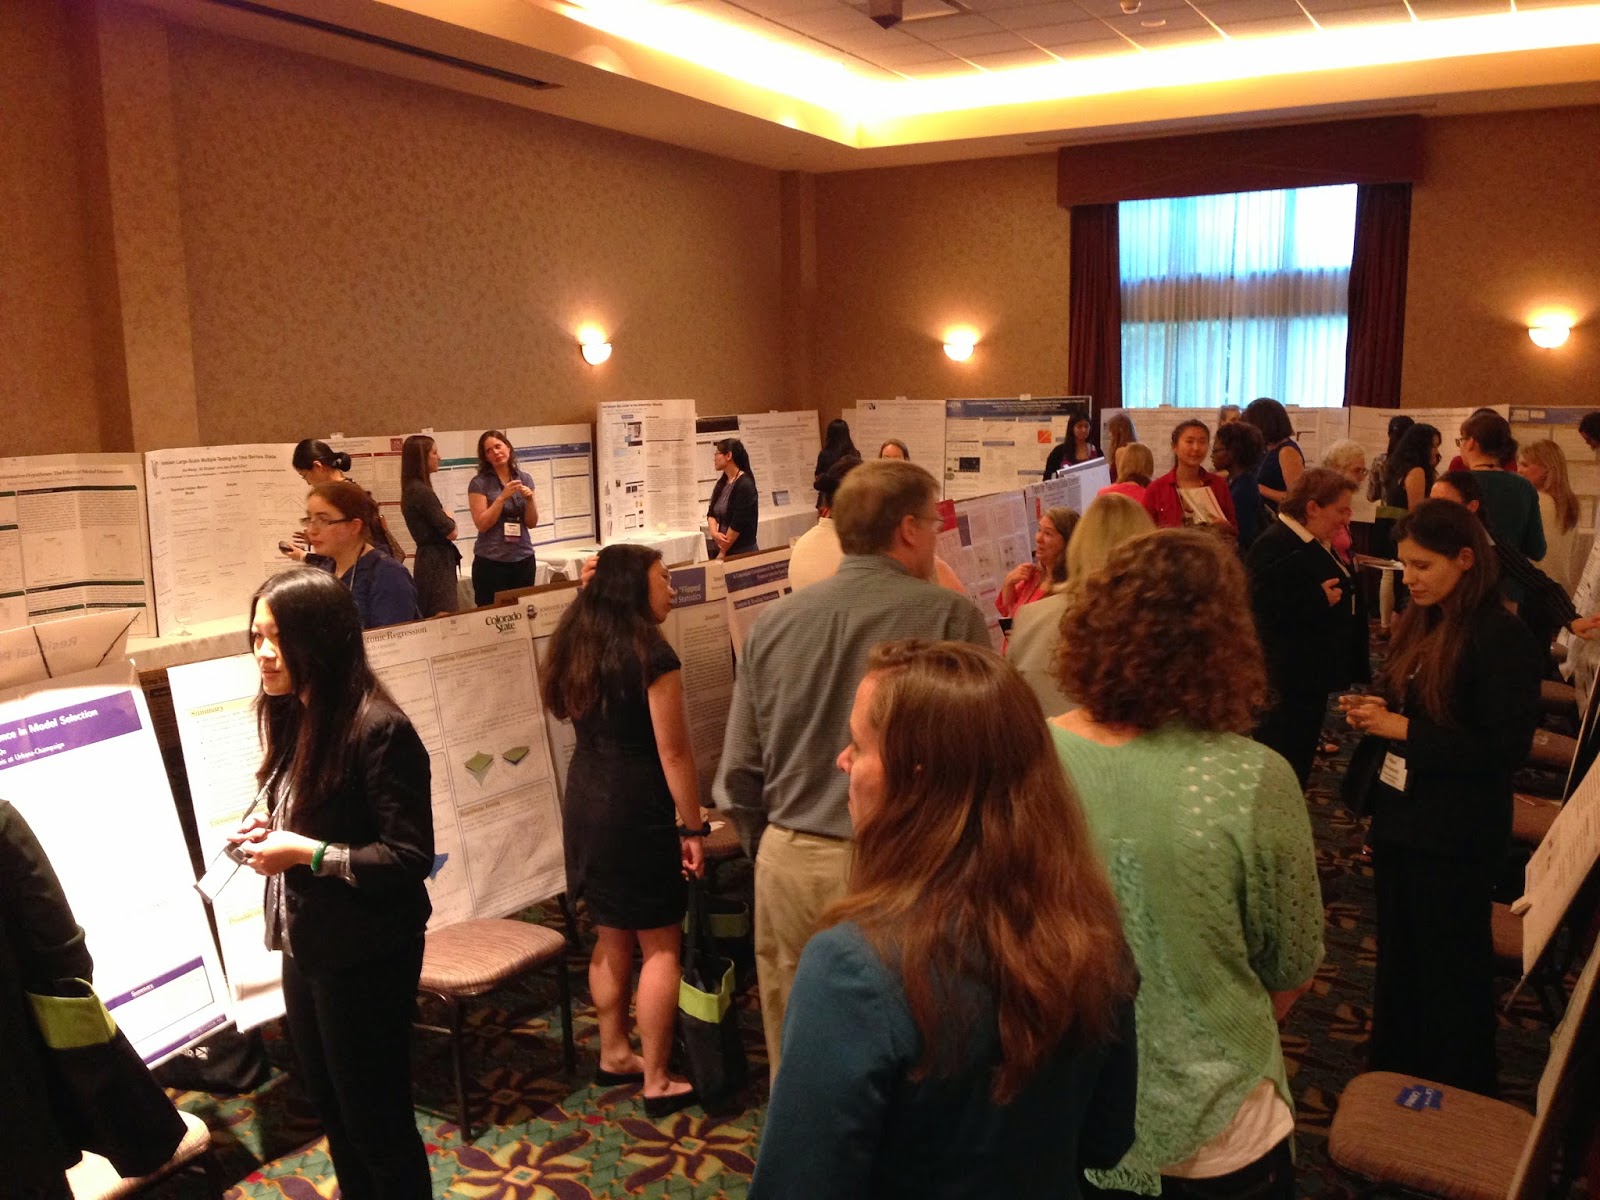
Mixing and mingling at the poster session Friday night

A little bit of fun: superhero statisticians to the rescue (post-poster session)! 

Sally Morton sharing some of her experiences from the conference including her first "selfie" 

 The amazing Grace Wahba and her "Ah-ha" moments

Thanks to all sponsors.
Platinum: Duke U, NIGMS/NIH, ASA, Minerva Research Foundation, Walmart
Gold: IBM, Lowe's
Silver: Biogen Idec, Experian, Lilly, Minitab, Morestream, SAS
Bronze: Berry Consultants, Cytel, JMP, Nielsen, NC State, Rho, RTI, Stata, UNC, Westat

Wednesday, May 14, 2014

The inaugural Women in Statistics Conference

This week is the inaugural Women in Statistics Conference being held May 15-17, 2014 in Cary, North Carolina. This conference is targeted at women at varying stages starting from graduate school all the way through tenured professors or well-funded CEOs in industry.  As a female statistician (and a postdoctoral fellow), I am very excited to attend this conference celebrating women in statistics!  Here are a few of the reasons why: 
  1. The opportunity to listen to and to interact with an entire community of female statisticians from industry, academia & government is one of the most attractive aspects of this conference. Not only will these talks/breakout sessions focus on a diverse set of career opportunities, they will also focus on useful topics on how to obtain these positions e.g. Answering tricky interview questions, Things I wish I knew when I started working, Optimizing your job search, How to negotiate what you are worth, The value of internshipsPreparing for promotion in academia, etc. These are all topics both men and women in our field can benefit from, so I plan to create a second blog post summarizing ideas/notes that are relevant for the entire statistical community.  
  2. Statistics as a discipline is currently facing its own set of challenges within the larger community of Science, Technology, Engineering and Mathematics (STEM), one including being able to attract women to the STEM fields. Many people have suggested ideas and discussed reasons why this is happening. I cannot speak for other women, but I can say one of the reasons why I am I where I am today is the copious amount of support that I have receieved from not only my family and friends, but most importantly from my mentors, faculty advisors and peers.  I was fortunate enough to not have "a terrible graduate school experience", but rather one filled with mentoring, guidance and patience. I know this conference will also be filled with mentoring and guidance from other female statisticians, many of which I consider to be role models. Conferences like this provide women with the information and tools needed to thrive not only in statistics, but in the larger STEM fields as well.  
  3. The idea of gender inequality in the field of statistics is not a new story, but it has been recently discussed in several articles. Ingram Olkin and Terry Speed both discussed the fact that at JSM 2012 "of the four named lectures (i.e. Wald, Rietz, Neyman, Fisher), the seven medallion lectures, and the two invited lectures, none of them were women". Amanda Golbeck wrote an Op-ed titled Where Are the Women in the JSM Registration Guide? in which stated "a productive way to help recruit, retain and nourish women professionals is to provide strong role models for them".  I completely agree and this conference will discuss several of these issues in talks and breakout sessions on topics such as Increasing Visibility of Women in Statistics, Increasing the Number of Women AwardsRecruiting and Retaining Women and Minorities in Statistical Science, Women in Science: Contributions, Inspirations, and Rewards, and Finding Our Place in History: Decades of Women Pioneers and Trail Blazers to name a few.  
  4. I'm particularly excited about the Internet Activism: Using social media to enhance your career breakout session. I learned this idea of using social media as tool to keep up with the literature & make a internet presence for yourself fairly late in my graduate school career. It's a way academic departments and industries can learn about your research interests and contributions.  I know the use of social media has absolutely transformed the way I function as a researcher. I was introduced to this idea actually from the genetics/genomics community by attending the American Society of Human Genetics for the past several years.  I think statisticians haven't quite caught on to the social media bug like the world of genomics, but as statistics departments are grappling with the debate of adsorbing statistics into incredibly popular emerging field of "data science", this is a topic I think many statisticians would find particularly useful.  
In addition, I have been asked to lead a discussion on Taking on Leadership Positions on Saturday morning.  I thought about what questions might be the most useful to ask and here are a few ideas that I have come up with:
  1. What defines a good leader? Is it innovation, focus, communication, ability to hire creative people with diverse backgrounds, ability to risk failing?  Some articles I found relevant were the Harvard Business Review put out an article on Real Leadership Lessons of Steve Jobs and the Forbes Women Leaders Must Dive In, Not Just Lean In. What other articles are good reference points? 
  2. Who are some examples of great leaders inside or outside the field of statistics? 
  3. What are some examples of positions require leadership skills inside or outside the field of statistics?  What do these positions have in common? 
  4. In what ways might someone who does not have an innate ability to lead learn to lead?   Are the qualities (from Q1) usually inherited or can they be learned?  
  5. What are the different styles of leaders? 
  6. How do you balance a position of leadership and maintain a balanced life either with your research and/or family life? 

I welcome other thoughts/suggestions! I plan to live tweet as many talks/breakout sessions as I can (you can follow me @stephaniehicks), but I will definitely write a second blogpost summarizing my thoughts and key points taken away from the conference.  

Monday, May 20, 2013

Graduation and Other Oddities

The last few months have been filled with excitement and new adventures.  I sincerely apologize for the lack of posts.  I promise more statistical/scientific posts will follow very soon. For now, let me try to share a few highlights from the last few months.

In March, we welcomed a new addition to our household: a 2013 Scion FR-S (color 'hot lava')!  We are still working on naming it, but currently the top two contenders are the 'Atomic Carrot' and the 'CarrotMonster'.  Here is a picture of Chris grinning ear to ear in the car lot the day we drove it home:


After a few months of getting to know the car and taking 'an extreme driving course', Chris put the car to the test at the Sports Car Club of America (SCCA) autocross. Here a group of cars getting lined up to race: 


Later in March Rice University was host to the Conference of Texas Statisticians (COTS). Keith Baggerly gave a beautiful keynote talk discussing his famous talk When is Reproducibility an Ethical Issue? Genomics, personalized medicine, and human error.  See his appearance on 60 Minutes for further details related to the story about Potti at Duke University


April was a very exciting month around here!  I ran in the Digital Run 5K Houston with a wonderful group of friends.  It was advertised as a 'nocturnal wonderland' filled with lots of LED lights, fun music and an after party!  Amazingly it was quite cold the night we ran, so here we are all bundled up with our cool glasses: 


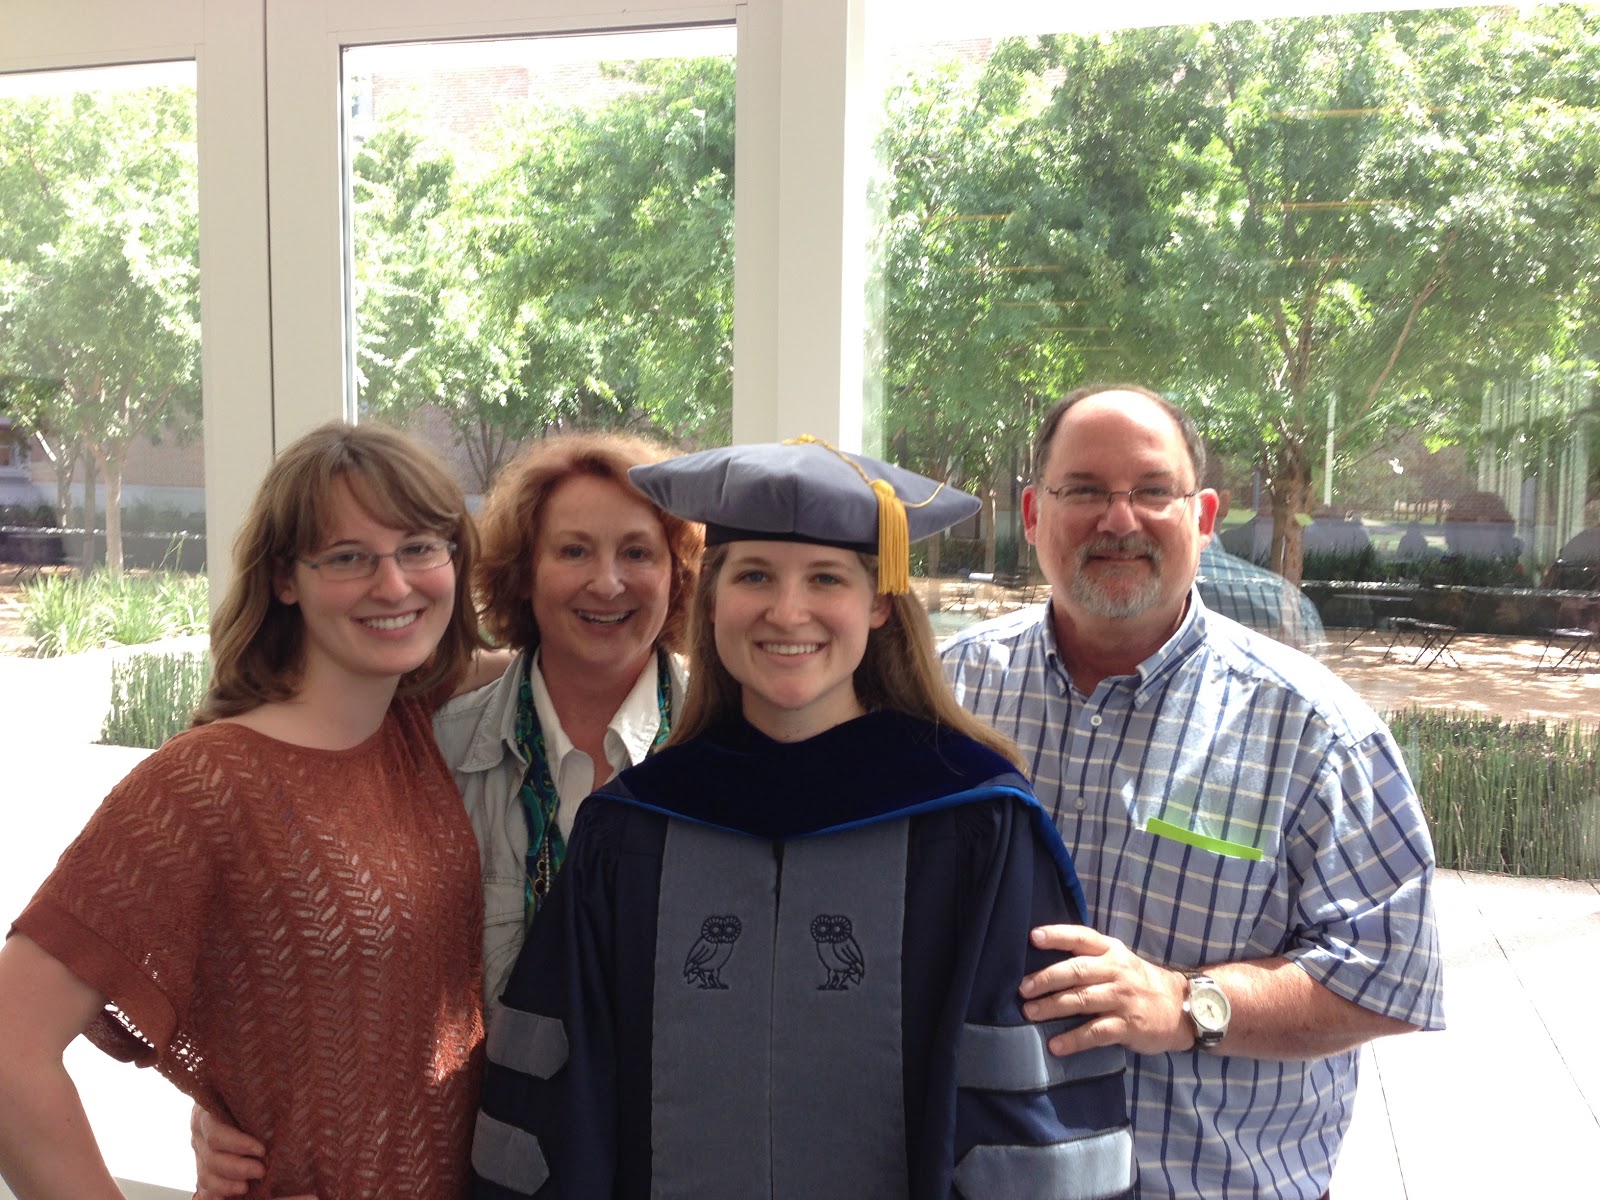
Finally, the main reason the frequency of posts have come to a halt was the successful completion of my Ph.D. defense on April 12th!  The Hooding ceremony was held on May 10th in which my research advisor Marek Kimmel (pictured below) was able to hood me: 


Rice University's 100th Commencement ceremony was held May 11th and we were fortunate enough to have Neil deGrasse Tyson as our commencement speaker! :)  Here are a few pictures of my amazing family: 


To close, I leave you with a fun Pi Day fact to ponder (courtesy of my Dad) :)


Thursday, May 17, 2012

Interface 2012: Day 2

JCGS Highlights at the Interface session 
With several great choices to pick from, my Day 2 of the Interface conference began in the JCGS Highlights at the Interface session to listen to Jennifer Le-Radamacher of University of Georgia give a talk on using symbolic-coveriance PCA and visualization techniques for interval-valued data.  The visualizations she showed were very interesting, but it was suggested she check out the colorspace palette in R to further improve her figures.

Information Mining session
Next, I moved to the Information Mining session to hear William Szewcyzk from the NSA give a talk on streaming exploratory data analysis.  He began by summarizing the process of data analysis in five steps: 1) choose a default model which is very controversial subject in itself because he said even if you just describe the data with its mean and variance, you are implicitly assuming the data can be described by the first and second moments of the distribution 2) project your data onto the model 3) examine the fit or lack thereof of the data to the model 4) adjust the model accordingly 5) repeat.  For streaming data, you have to make a slight modification to this process because people incorrectly assume they think they are the only ones working on that flow of data and their process is the last one to touch the data.  Finally he proposed a "default model for streaming data" similar to the way people often assume a gaussian distribution as the default model for static data. The last speaker of the session Andy Frenkiel of IBM gave a thought provoking talk on filling in the gaps of news stories when there is missing information using keyword searches.

Contributed Paper Session II
Xueying Chen of Rutgers University began this session with her split and conquer approach for extremely large datasets.  In her talk, she randomly splits a data set into subsets, estimates a penalized logistic regression model within each subset and finally combined the estimates from the subsets in a final set of coefficient estimates. The second speaker was Garrett Grolemund of Rice University (pictured below) who gave a wonderful demo of his R package Lubridate which greatly simplifies the process of working with dates, times and time zones.  Some great features include the ability to display the same instant of time in different time zones, to save and use time intervals as a class object in R and the test whether certain dates fall "%within%" a different set of dates.  I'll also advertise for his online course for Visualization in R with ggplot2 on June 19-20!


David Kahle of Baylor University (pictured below) gave the final talk of the session on his useful R package mpoly which allows user to work with multivariate polynomials within R.  There are three other packages in R which work with polynomials, but they are not very intuitive or efficient to work with.  Some features include a new class of mpoly objects, basic arithmetic/calculus such as gradients, algebra, and finally evaluating polynomials.


Woman VS Machine: The Inference Battle session
After lunch, quite a few conference attendees move into the Woman VS Machine: The Inference Battle session. The session began with Andreas Buja who gave a thought-provoking talk on the problems with post-selection inference and proposed the Post Selection Inference (PoSi) constant which allows valid post-selection inference. Interestingly, PoSi guarantees coverage of CIs and Type I errors of tests and is not specific for any type of model selection. The second speaker in the session Heike Hofmann outlined the concepts of visual inference within the framework of exploratory data analysis. In a classical statistical setting, we reject the null hypothesis if the test statistic is past some threshold, but in a visual setting, she argued we would reject the null hypothesis (i.e a plot is not distinguishable from null plots) if the data plot is identifiable.  A great example was shown in which she simulated random data in four dimensions and included one plot with the real signal. Due to the artifact of high dimensionality, the audience was not able to pick it out (including me!).  Finally, she described a set of experiments they designed using Amazon Mechanic Turk in which they recruited people to look at a line-up of plots to pick out which ones were different from the rest using criteria such as bi-modality, outliers and mean shift (and showed how the power estimates). Very curious results. The last speaker Mahbub Majumder described these "Turk experiments" in greater detail. The session ended with a great question from the audience about the reproducibility of this type of research (which I believe should be as long as the same plots could be used again).

Banquet Keynote
Mark Hansen of UCLA gave an amazing keynote talk for the banquet tonight!  I was very impressed with the quality of graphics and art projects he has produced over the last decade.

I will wrap up with a few pictures from the banquet of some current and past PhD students at Rice.


Wednesday, May 16, 2012

Interface 2012: Day 1

Today was the first day of the 43rd Interface Conference 2012 which is being held at Rice University this year (follow me with updates on twitter with hashtag #Interface12) There were several concurrent technical sessions going on through out the day, so I only post about the ones I attended.  It was an early start to the morning, but the coffee definitely helped.  :)


Keynote speaker
The keynote speaker Trevor Hastie from Stanford gave a wonderful talk this morning on methods for low-rank factorization with missing data (perfect application for the Netflix data).  He specifically discussed the methods Soft-Impute (soft threshold SVD) and Hard-Impute and showed their relationship to the Maximum Margin Matrix Factorization (MMMF).  His method has an expectation-maximization flavor to it and is similar to alternating ridge regression.  Finally he ended with a few generalizations including Convex Robust Completion (Robust SVD).  When the data matrix X can be approximated by L (a low-rank matrix) + S (sparse matrix), then the method just adds a penalty parameter on a sparse matrix in addition to penalty parameter on the low rank matrix.  I enjoyed the level of detail in this talk.


Software Development in R session
After the keynote, I decided to attend the Software Development in R technical session.  The first speaker JJ Allaire (founder of Rstudio) gave a great high level demo of many useful features in Rstudio.  He stressed the importance of "reproducible research" and "trustworthy computing".  Some of the most exciting things in Rstudio include: a searchable history for any piece of code ever run through the console, page back through plots, quickly traverse through nested functions, interact with Git and SVN and incorporation of Sweave and knitr.  You can easily navigate between chunks of code and even be pointed back to the source code after clicking on a complied pdf.  Rstudio now has the feature of writing in the markdown language to quickly publish high quality web pages instead of having to deal with html.  The second speaker in the session Norm Matloff of UC Davis discussed parallel computing in R. He reviewed classical shared-memory loop scheduling methods (static, dynamic, time-varying chunk size, etc) and how to these might be adapted to R. The example he discussed was how to parallelize all possible regressions in a given data set with dim(X) = n x p.  The available R packages discussed for parallel computing were:
  1) snow - serializes/deserializes communications which takes time; most used R package; the functions clusterApply() is static and clusterApplyLB() is dynamic; both limited to a fixed chunk size of 1 (small chunk sizes not good because of high overhead); chunk size > 1 must be programmed by user
  2) Rmpi - more flexible than snow, but still has serialization and network problems
  3) mclappy/multicore - each call involves new unix process creation
  4) gputools - each call involves a GPU kernel invocation, time intensive; major overhead
He suggested a new scheduling method called 'Random Scheduling'.  After making this small adjustment, then you can use the R packages as before (e.g. snow).  For his presentation slides go here and his open source book go here.  The final speaker of the session Duncan Murdoch gave a great overview of the older tools available for debugging and some examples of visual debuggers.


Statistical Models for Complex Functional Data session
The session started out with Todd Ogden of Columbia University who discussed sparse functional principal component regression to predict depression using MRI images as the functional data.  He mentioned other statistical learning tools such as random forests may be more accurate, but he advocated for using a regression-based method with functional data because functional regression has a clear interpretation of the weight function.  After expressing the functional components in the wavelet domain he applies penalization techniques such as wavelet-based LASSO to the functional model.    The basic idea is to perform sparse functional principal component analysis and then use the loadings as the predictors.  The second speaker Lan Zhou of Texas A&M showed how to use penalized bivariate B-splines in functional data analysis to estimate variability in Texas temperatures over the past 100 years.  Because Texas or the "domain" is complicated (e.g. not rectangular, contains holes, etc), she uses the idea of triangulations.  The goal is to estimate a bivariate smooth function over the domain to create a temperature map using data from weather stations and to investigate the variability in temperatures over the years.  Veera Baladandayuthapani of UT MD Anderson wrapped the session up by discussing a bayesian functional mixed model for copy-number variation data measured by aCGH array data and extending it for SNP array data (higher resolution).  The goal was to do a joint analysis on set of samples to look for a small signal by borrowing strength between the samples.

So far the talks have been excellent and I'm looking forward to the rest of the sessions tomorrow and Friday!

Monday, April 30, 2012

Freely Available Machine Learning Data sets

I cam across a great resource for anyone in statistics / machine learning! It's called the UCI Machine Learning Repository.  The website contains over 200 downloadable data sets and it is even classified by the task (classification, regression, clustering, etc), data type (multivariate, time-series, ... ), area (biological, business, ... ), and number of covariates.   Very valuable resource.


Tuesday, April 10, 2012

Steve Stigler gives a talk at Rice University

As part of the celebration the 25th anniversary of the Department of Statistics at Rice University, Steve Stigler gave a talk yesterday titled 'How a Statistical Idea Saved Darwin's Theory and Much More'. He began his talk with some old pictures of  how the department was founded including pictures of the founding mathematics department in 1927.


Then Steve discussed some very influential mathematicians and probabilists who helped contributed to some important ideas in statistics such as 'The Rule of Three'.  A brief summary would be if the following relationships holds
\[ \frac{A}{B} = \frac{C}{D} \]
and you know any of the three out of the four (A, B, C, D), then you can easily solve for the fourth.  In 1855, Charles Darwin is even quoted saying, "I have no faith in anything short of actual measurement and the Rule of Three".  Karl Pearson suggested this be the motto of the journal Biometrika.  For a full description of the story, see the publication Stigler (2012) in Biometrika.

Interestingly, Francis Galton made the discovery that if data were perfectly correlated then the Rule of Three is true.  When data is not perfectly correlated, then the idea of a conditional distribution must be introduced.  The example that led to this discovery was an anthropologist was studying skeletons in a grave site.  He let $T$ = length of a man's thigh bone and $H$ = man's height.  After measuring several complete skeletons, he averaged $m_T$ = mean of thigh bones and $m_H$ = mean of heights.  Then anthropologist wanted to infer heights from thigh bone lengths.  He made the assumption that
\[ \frac{m_T}{m_H} = \frac{T}{H} \]
What Galton discovered is that if the data were perfectly correlated, then this formula would work.  Because this assumption did not hold, Galton stumbled on to what we now call correlation.  This led to the idea of expectations of conditional distributions, and hence the regression line!  Very interesting story.

Steve ended his talk with some encouraging words about the Statistics Department at Rice. He showed this picture which was taken at Rice when Emile Borel visited.


The night ended with a nice dinner in Duncan Hall hall with pictures, awards and a lovely cake.


Congratulations to the Department of Statistics at Rice!  I'm excited to see what the next 25 years has to hold.